IMAGE

Figure 6

ID
ZDB-IMAGE-251029-45
Source
Figures for David et al., 2024
Image
Figure Caption

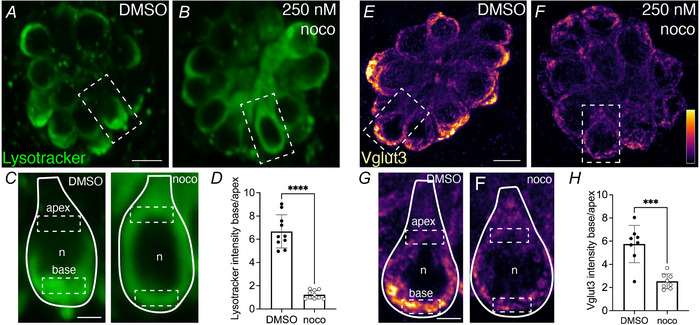
Figure 6 An intact microtubule network is required to enrich LysoTracker and Vglut3 at the presynapse

A–C, example live image of LysoTracker Red (green) to label synaptic vesicles in neuromasts at 5 dpf in wild‐type larva treated with 250 nm nocodazole (B) or DMSO control (A). The dashed box in each image indicates the hair cell magnified and outlined with a continuous line in C. D, quantification shows significantly less LysoTracker enrichment at the cell base in nocodazole‐treated larvae compared with DMSO control (control: 6.68 ± 1.43; nocodazole: 1.22 ± 0.37, n = 10 control and nocodazole neuromasts, unpaired t test, P < 0.0001). E–G, example immunolabel of Vglut3 to label synaptic vesicles in neuromasts at 5 dpf in larva treated with 250 nm nocodazole (F) or DMSO control (E). The dashed box in each image indicates the hair cell magnified and outlined with a continuous line in G. H, quantification reveals significantly less Vglut3 enrichment at the cell base in nocodazole‐treated larvae compared with DMSO controls (control: 5.75 ± 1.61; nocodazole: 2.53 ± 0.65, n = 8 control and nocodazole neuromasts, unpaired t test, P < 0.0001). The solid lines in the magnified images outline a single hair cell, with the base of the cell at the bottom of the image, and dashed boxes indicate example ROIs of the apical and basal regions used for quantification. n indicates nucleus. Scale bars in A and E = 5 µm and 2 µm in C and G.

Acknowledgments
This image is the copyrighted work of the attributed author or publisher, and ZFIN has permission only to display this image to its users. Additional permissions should be obtained from the applicable author or publisher of the image. Full text @ J. Physiol.