
FIGURE 6
- ID
- ZDB-IMAGE-251023-85
- Publication
- Kakiailatu et al., 2025 - Retinoic Acid Inhibition Alters Intestinal Composition in Zebrafish: A Non-genetic Model to Study Hirschsprung Disease?
- All Figures
- Figures for Kakiailatu et al., 2025
|
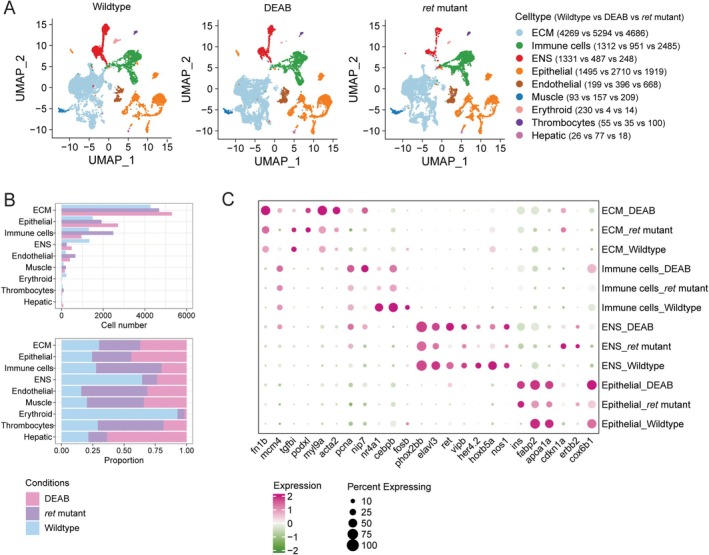
FIGURE 6
Single‐cell transcriptomic analysis of intestinal cell populations in wildtype,