
FIGURE 1
- ID
- ZDB-IMAGE-251023-80
- Publication
- Kakiailatu et al., 2025 - Retinoic Acid Inhibition Alters Intestinal Composition in Zebrafish: A Non-genetic Model to Study Hirschsprung Disease?
- All Figures
- Figures for Kakiailatu et al., 2025
|
FIGURE 1
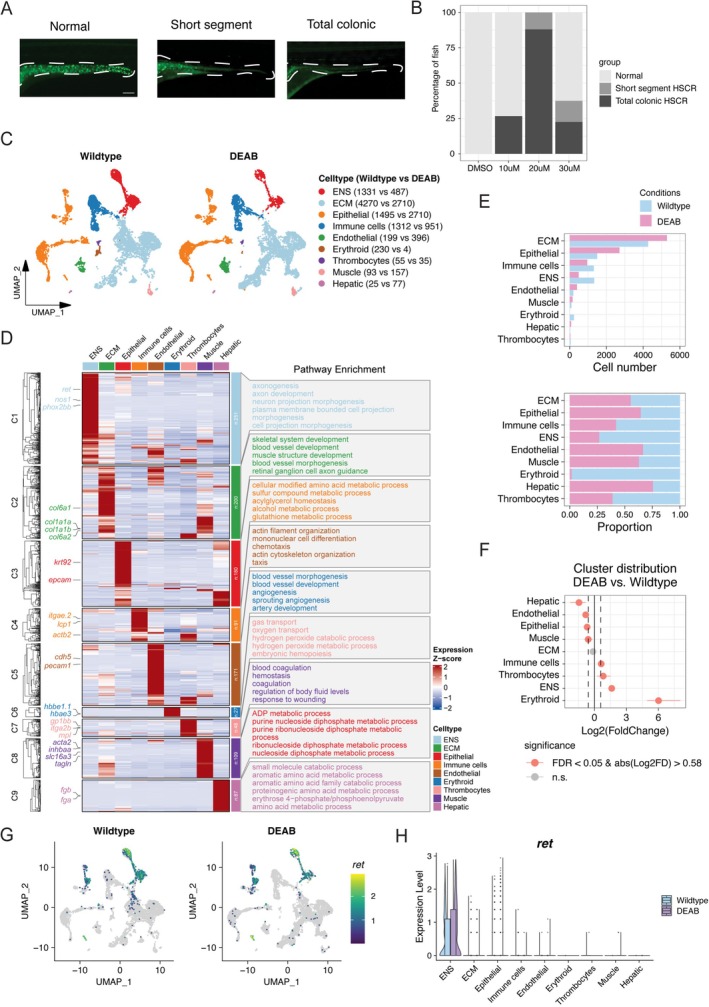
Single‐cell transcriptomic profile of zebrafish intestinal cells in wildtype and DEAB‐treated zebrafish. (A) Representative images of ENS phenotypes in tg(