IMAGE

Fig. 5

ID
ZDB-IMAGE-251023-46
Source
Figures for Kim et al., 2025
Image
Figure Caption

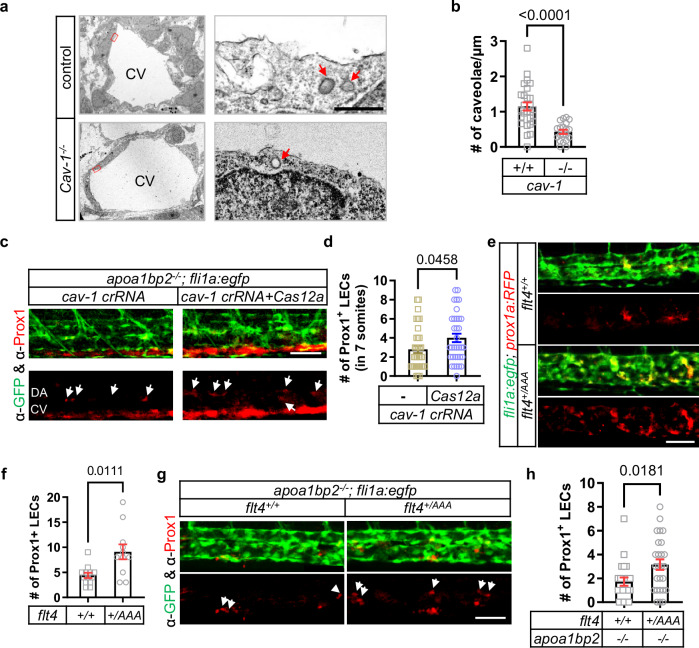
Fig. 5 Effect of CAV-1 on Aibp2-regulated LEC specification.

a Representative TEM images of control and cav1−/− zebrafish. Arrows show typical caveolae in cardinal vein ECs. b Quantification of caveolae in a. n = 27 (control) and n = 20 (cav1−/−) cells. c Maxi-projection confocal images of Prox1+ cells in the 36 hpf apoa1bp−/−; fli1a:egfp zebrafish with cav-1 crRNA alone or cav1-crRNA and Cas12a protein co-administration. Arrows show the Prox1+ LECs in cardinal vein. Green marks blood vessels, and red marks Prox1 staining. d Quantitative data of Prox1+ LECs in cardinal vein (7 somites) of (c). n = 34 embryos in both groups. e Representative confocal images of LEC specification in the cardinal veins of Vegfr3AAA knock-in zebrafish at 36 hpf. Green marks blood vessels, and red marks Prox1+ cells. f Quantitative data of LEC numbers in (e). n = 13 (flt4+/+) and n = 11 (flt4+/AAA) embryos. g Confocal imaging of Prox1+ LECs in the indicated genetically modified fli1a:egfp zebrafish at 36 hpf. Green marks blood vessels, and red marks Prox1 staining. h Quantitative data of Prox1+ LECs of 7 somites in (g). n = 22 (apoa1bp−/−; flt4+/+) and n = 26 (apoa1bp−/−; flt4+/AAA) embryos. Mean ± SE in b, d, f, and h; unpaired two-sided t-test with Welch’s correction. CV cardinal vein. Scale bar: 500 nm in a; 50 µm in c, e, g. Source data are provided as a Source Data file.

Acknowledgments
This image is the copyrighted work of the attributed author or publisher, and ZFIN has permission only to display this image to its users. Additional permissions should be obtained from the applicable author or publisher of the image. Full text @ Nat. Commun.