
Figure 3.
- ID
- ZDB-IMAGE-251023-21
- Publication
- Jamialahmadi et al., 2025 - Genome-wide interaction study with BMI identifies CYP7A1 and GIPR as genetic modulators of MASLD
- All Figures
- Figures for Jamialahmadi et al., 2025
|
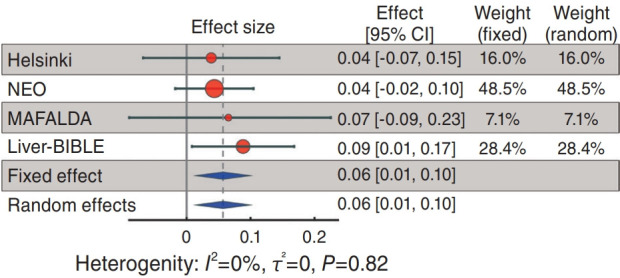
Figure 3.
Forest plot for association of controlled attenuation parameter and magnetic resonance spectroscopy hepatic fat content with the