
Figure 2.
- ID
- ZDB-IMAGE-251023-20
- Publication
- Jamialahmadi et al., 2025 - Genome-wide interaction study with BMI identifies CYP7A1 and GIPR as genetic modulators of MASLD
- All Figures
- Figures for Jamialahmadi et al., 2025
|
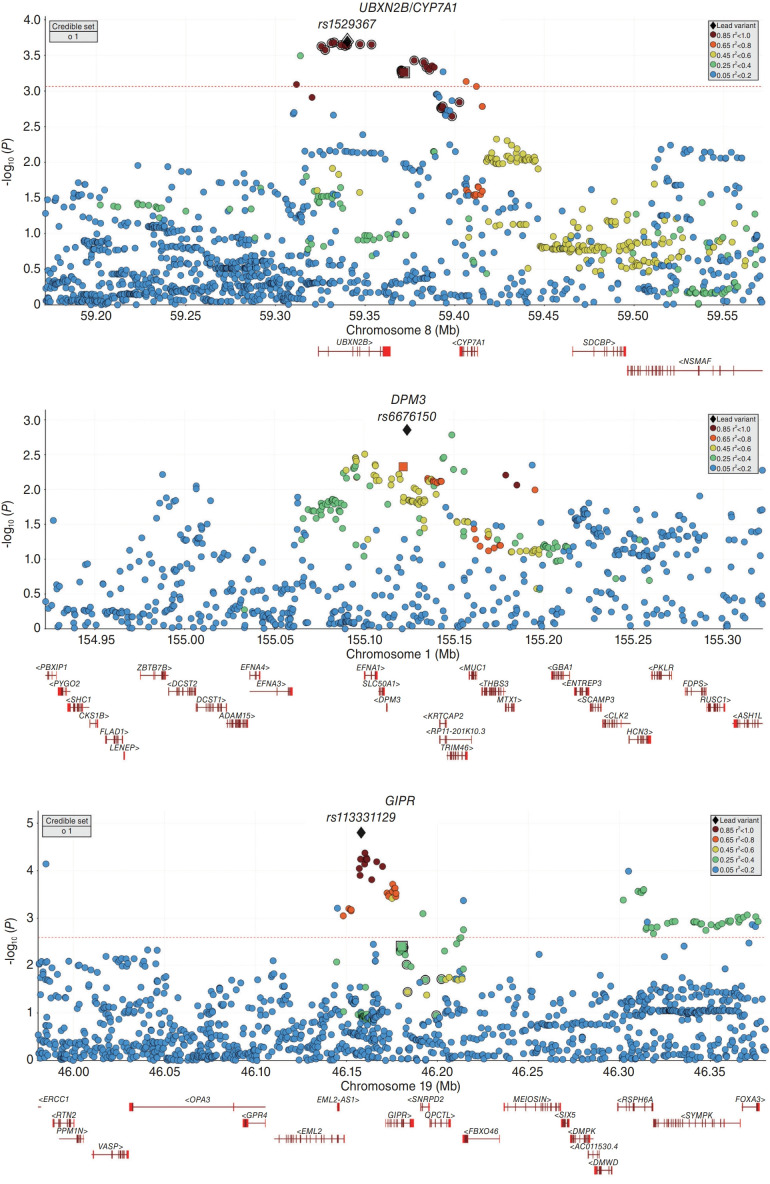
Figure 2.
Regional plots for association of 3 new loci with PDFF. For each locus, a window of ±200 kb around lead variants from GEWIS on ALT was considered. The lead variants from the GEWIS for ALT and GWAS on PDFF are marked with a square and black diamond, respectively. Credible set indicates putative causal variants from the GEWIS for ALT. Red dashed line represents the FDR threshold using the Benjamini-Hochberg method. Data from a total of 337,000 unrelated White-British participants from UK Biobank were used for insample LD structure. ALT, alanine aminotransferase; GEWIS, genome-wide-environment interaction study; GWAS, genome-wide association study; PDFF, proton density fat fraction; FDR, false discovery rate; LD, linkage disequilibrium.