IMAGE

Figure 1.

ID
ZDB-IMAGE-251023-19
Source
Figures for Jamialahmadi et al., 2025
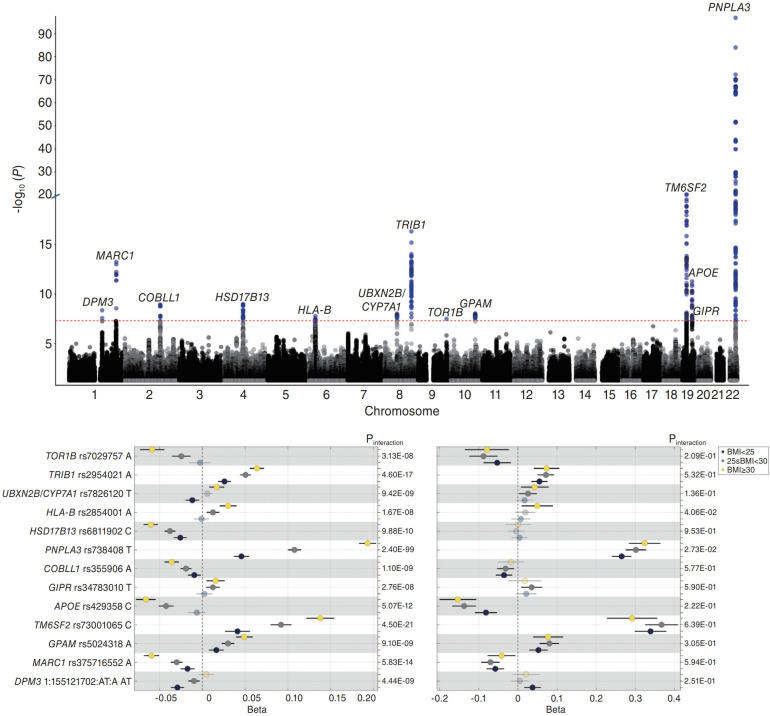
Image
Figure Caption

Figure 1.

13 loci interact with BMI for ALT. Top: Manhattan plot of genome-wide interaction analysis with BMI for ALT in European ancestry participants (UK Biobank). P-values were calculated by using a whole-genome regression model in REGENIE. Red dashed line represents the genome-wide significance level, 5E-8. Bottom: association of ALT (left) and PDFF (right) with 13 loci that interact with BMI for ALT stratified by BMI. Associations were examined using linear regression analysis adjusted for BMI, age, sex, age×sex, age2 and age2×sex, first 10 genomic principal components and array batch. For ALT, the association analyses have been performed after excluding individuals with PDFF data. The x-axis represents beta coefficients, with error bars showing 95% confidence intervals. Greyed-out circles represent associations with a nominal P-value>0.05. The SNP-BMI interaction P-values are displayed as a secondary y-axis on the right-hand side of each panel. ALT, alanine aminotransferase; BMI, body mass index; PDFF, proton density fat fraction; SNP, single nucleotide polymorphism.

Acknowledgments
This image is the copyrighted work of the attributed author or publisher, and ZFIN has permission only to display this image to its users. Additional permissions should be obtained from the applicable author or publisher of the image. Full text @ Clin Mol Hepatol