
|
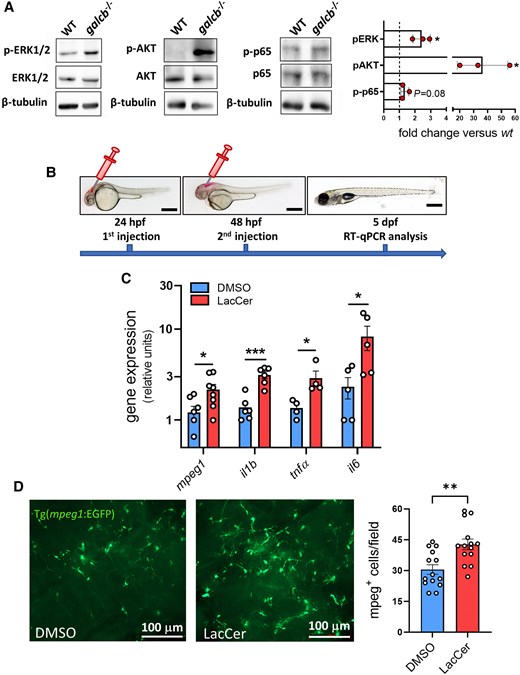
Fig. 7 LacCer induces a proinflammatory phenotype in zebrafish brain. (A) Western blot analysis of ERK1/2, AKT and p65 phosphorylation in the brain of wild-type (WT) and galcb knockout (KO) zebrafish showing the activation of signalling pathways associated to LacCer accumulation in galcb KO zebrafish at 4 months post fertilization. Right: Quantification of immunoreactive bands obtained in three independent experiments. (B) Schematic of the experimental procedure for intraventricular injection of GalCer in zebrafish embryos. (C) RT-qPCR analysis of the expression levels of the inflammatory markers interleukin-1b (il1b), tumor necrosis factor-a (tnfa), il6 and macrophage expressed 1 (mpeg1) following a double intraventricular injection of 0.4 ng of LacCer in the brain of WT zebrafish embryos. For each gene, the data were normalized to its expression in one dimethyl sulfoxide (DMSO)-injected animal. Data are the mean ± standard error of the mean of 4–6 pools of 7 embryos per group. Scale bars: 500 μm. Student's t-test: *P < 0.05, **P < 0.01. (D) Fluorescent microscopic analysis following double injection of 0.4 ng DMSO or LacCer in the brain ventriculus of Tg(mpeg1:EGFP) zebrafish embryos shows a significant infiltration of mpeg1-positive macrophages in LacCer injected brains. Right: Quantification of mpeg1-positive cells in harvested brains. Data are the mean ± standard error of the mean of ≥3 microscopic fields per animals (n = 4). Scale bars: 100 μm. Student's t-test: **P < 0.01. LacCer = lactosylceramide; RT-qPCR = reverse transcriptase-quantitative PCR.