
|
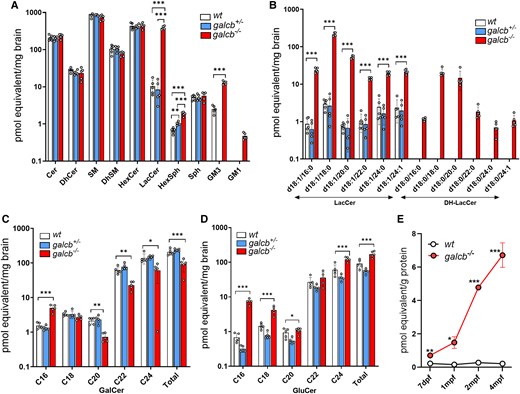
Fig. 5 Targeted sphingolipid analysis of the brain of galcb knockout zebrafish. The targeted sphingolipid analysis of the brain of wild-type (WT), galcb+/− and galcb−/− zebrafish was performed for the indicated lipid classes at 4 months post fertilization (mpf). (A) Levels of the different sphingolipid classes as sum of all the species analysed. (B) Levels of the different LacCer and DH-LacCer species. LacCer = lactosylceramide. (C and D) Levels of GalCer and GluCer species. Data are the mean ± standard error of the mean of five animals per group. One-way ANOVA (Tukey's multiple comparison test): *P < 0.05, **P < 0.01, ***P < 0.001. Cer = ceramide; DH-Cer = dihydro-Cer; SM = sphingomyelin; DH-SM = dihydro-SM; HexCer = hexosylceramide; Sph = sphingosine; HexSph = hexoxylsphingosine. (E) Levels of LacCer at different developmental stages in WT and galcb−/− animals. Data are the mean ± standard error of the mean. Student's t-test: *P < 0.05, **P < 0.01, ***P < 0.001.