
|
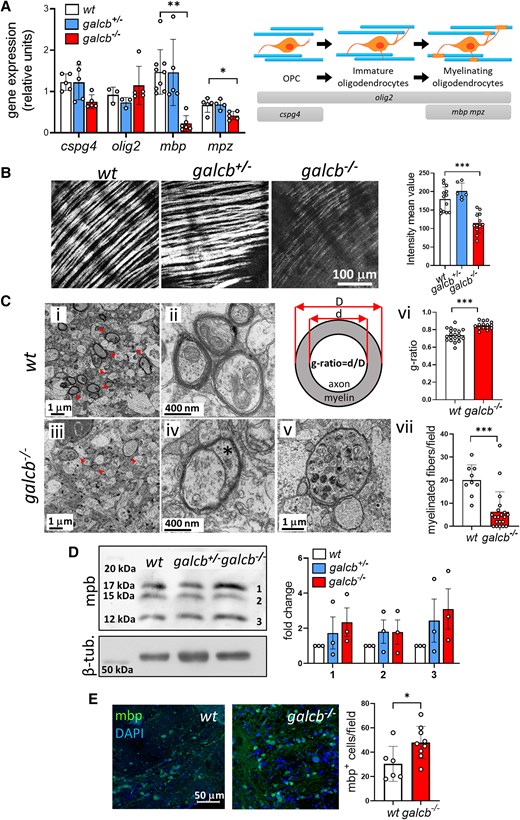
Fig. 3 Brain demyelination in galcb knockout zebrafish. (A) RT-qPCR analysis of the expression of oligodendrocyte (OL) and myelin marker genes cspg4, olig2, mbp and mpz in the brain of wild-type (WT), galcb+/− and galcb−/− zebrafish at 4 months post fertilization (mpf). For each gene, the data were normalized to its expression in one WT animal. Data are the mean ± standard deviation (SD) of 3–5 animals per group. Right: Schematic representation of OL differentiation and relative gene markers. (B) Spectral confocal reflectance microscopy analysis of the optic tectum of WT, galcb+/− and galcb−/− zebrafish at 4 mpf. Similar results were obtained in three animals per group. Right: Quantification of the myelin signal intensity in ≥ 6 microscopic fields/group. (C) Transmission electron microscopy analysis of the diencephalon of WT siblings (i and ii) compared with galcb knockout mutants (iii–v). Myelin structural alterations, thinner myelin sheets and degenerated axons characterized by cytoplasmatic accumulation of mitochondria and lysosomes are detectable in galcb−/− mutants. [C(vi)] g-Ratio was calculated for five myelin fibres in 3–4 microscopic fields. [C(vii)] Myelinated fibres (arrowheads) were counted in >10 microscopic fields/group. (D) Western blot analysis of mbp protein levels in the brain extracts of WT, galcb+/− and galcb−/− zebrafish at 4 mpf. β-tubulin was used as loading control. Right: Quantification of the three immunoreactive mbp protein bands does not show any statistical difference among the three experimental groups (data are from three independent experiments). (E) Immunofluorescence analysis shows the presence of numerous mbp-positive cells in the brain of galcb−/− zebrafish at 4 mpf. 4′,6-diamidino-2-phenylindole (DAPI) was used for nuclear counterstaining. Right: Quantification of mbp signal intensity in ≥6 microscopic fields/group. Data are the mean ± SD. One-way ANOVA (Tukey's multiple comparison test) in A, B and D; Student's t-test in C and E: *P < 0.05, **P < 0.01, ***P < 0.001. OPC = oligodendrocyte precursor cell; RT-qPCR = reverse transcriptase-quantitative PCR.