
Fig. 5
- ID
- ZDB-IMAGE-251010-58
- Publication
- Pan et al., 2025 - A novel phex gene variant causes non-syndromic tooth agenesis
- All Figures
- Figures for Pan et al., 2025
|
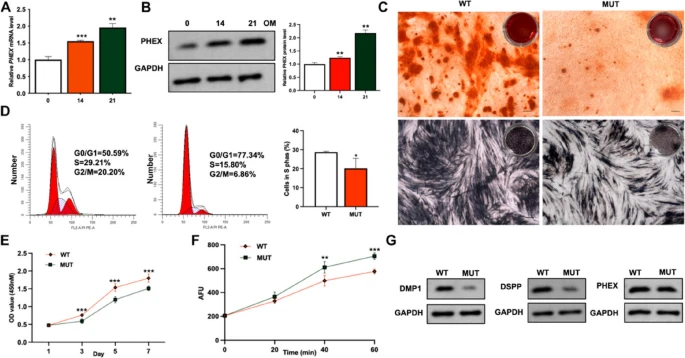
Fig. 5 The qRT-PCR A and Western blot B results demonstrate upregulation of PHEX expression during mineralization induction in DPSCs (qRT-PCR: n = 3 per time point, 4 independent experiments; Western blot: n = 3 per time point, 3 independent experiments). C The results of ARS and ALP staining reveal reduced mineralization capability in mutant cells (ARS: n = 6 per group, 4 independent experiments; ALP: n = 6 per group, 3 independent experiments). Cell cycle analysis D and CCK-8 assay E demonstrate reduced cell proliferation capability after mutation (Cell cycle: n = 3 per group, 3 independent experiments; CCK-8: n = 6 per group, 4 independent experiments). F PHEX enzyme activity assay showed enhanced enzymatic activity in the MUT group (n = 4 per group, 3 independent experiments). G Western blot results demonstrate that after mutation, the expression of PHEX enzyme substrates DMP1 and OPN is downregulated, while the expression of PHEX itself remains unchanged (n = 3 per group, 3 independent experiments). Data represent mean ± SEM. Statistical comparisons performed using Student’s t-test for two-group comparisons and one-way ANOVA followed by Tukey’s post hoc test for multiple comparisons. *p < 0.05, **p < 0.01, ***p < 0.001 vs. control group (DPSCs-WT)