
|
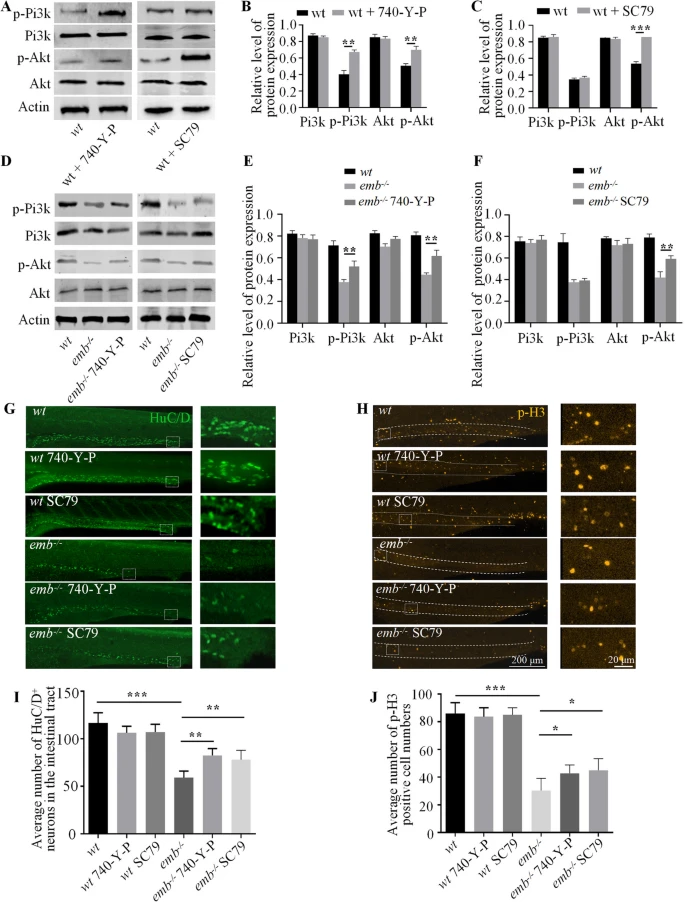
Fig. 5 Emb regulates ENS development through the activation of PI3K pathway in zebrafish. A-C, Validation of the efficiency of the PI3K/AKT agonists (740-Y-P and SC79) in wild type zebrafish. D, Western blots of total and phosphorylated PI3K and AKT of 5 dpf zebrafish larvae, before and after exposure of agonists, the protein levels are quantified in (E and F). Representative images of immunofluorescence staining to assess the number of enteric neurons (G, HuC/D) and the levels of cell proliferation (H, p-H3). In Figure G, the dashed box in the left panel marks the most distal enteric neurons positive for HuC/D; the right panel shows a magnified view of the boxed region. In Figure H, the dashed box in the left panel indicates a representative region with high PH3 expression; the right panel shows a magnified view of the boxed region. The quantification results are presented in I and J. *, p < 0.05; **, p < 0.01; ***, p < 0.001, one-way ANOVA with Bonferroni post-hoc, N = 10