
|
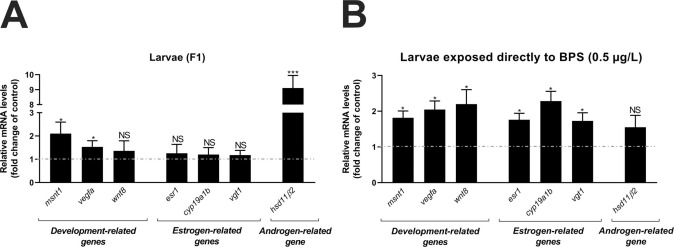
Fig. 5 Gene expression analysis of zebrafish larvae. Relative expression of genes related to development (mstn1, vegfa, and wnt8), estrogen (esr1, cyp19a1b, and vgt1), and androgen (hsd11β2) in zebrafish larvae. (A) Larvae (F1) derived from the mating of parental males exposed to BPS (0.5 µg/L) or DMSO (control) after 96 h in embryonic medium. (B) Larvae directly exposed to DMSO (control) or BPS (0.5 µg/L) for 96 h post-fertilization. Cts were normalized to the reference gene (β-actin) and expressed relative to the control group (DMSO). Data are presented as mean ± standard error of the mean (SEM) (n = 6 pseudoreplicates of 10 embryos per group) and as fold induction relative to the control (DMSO), indicated by the dashed line. (*) denotes a significant difference with p < 0.05. (NS) indicates no significant difference.