
|
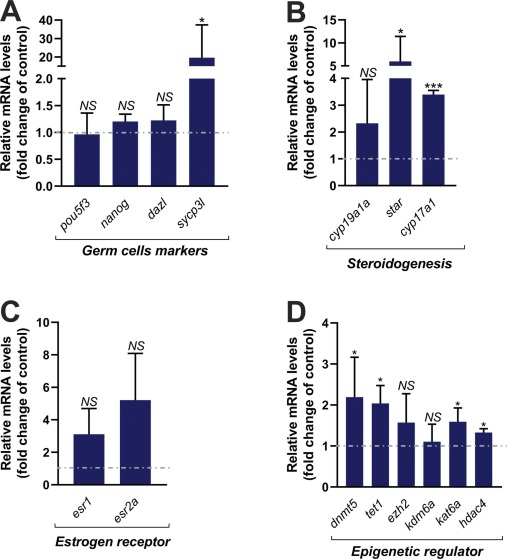
Fig. 3 Gene expression analysis of testes following exposure to BPS. (A) Relative transcript levels of germ cell marker genes (pou5f3, nanog, dazl, and scyp3l), steroidogenic enzymes (cyp19a1a, star, cyp17a1), estrogen receptors (esr1, esr2a), and epigenetic regulation genes (dnmt5, tet1, ezh2, kdm6b, kat6a, and hdac4) in zebrafish testes after 14 days of exposure to Vehicle (DMSO, control) or BPS (0.5 µg/L). Cts were normalized to the reference gene (β-actin) and expressed relative to the control group (DMSO). Data are presented as mean ± standard error of the mean (SEM) (n = 8) and as fold induction of the control (DMSO) represented by the dashed line. (*) and (**) represent significant differences with p < 0.05 and p < 0.001, respectively. (NS) indicates no significant difference.