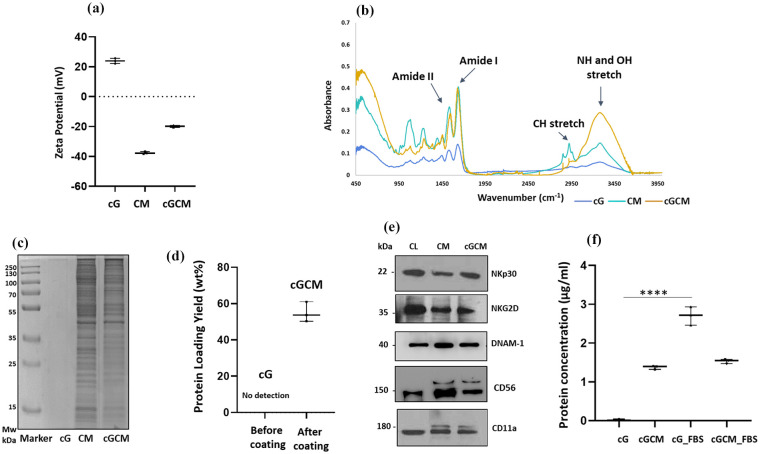
IMAGE

Figure 2.

ID
ZDB-IMAGE-251004-9
Source
Figures for Chugh et al., 2025
Image
Figure Caption

Figure 2.

Characterization of NK cell mimics: (a) surface charge on cG, CM and cGCM, N = 3, (b) Fourier transform infrared (FT-IR) spectra of cG, CM, and cGCM, (c) SDS-PAGE gel stained with coomassie brilliant blue dye to assess the protein profile on cG, CM and cGCM, (d) Protein loading yield (%) on cGCM, N = 3, (e) Western blot to identify specific protein (NKp30, NKG2D, DNAM-1) on CL, CM and cGCM, and (f) Protein absorption analysis on cG and cGCM after incubation in FBS for 3 h at 37°C (cG vs cG_FBS, p < 0.0001, 95% CI = −3.004 to −2.355), N = 3.

Abbreviations: cG: cross-linked gelatin microspheres; cG_FBS: cross-linked gelatin microspheres incubated in foetal bovine serum; cGCM_FBS: NK cell mimics incubated in foetal bovine serum; CL: KHYG-1 cell lysate; CM: isolated KHYG-1 cell membrane; cGCM: NK cell mimics; MW: molecular weight.

Graphs are plotted in box and whiskers format with max and min value showing all data points.

*p < 0.05. **p < 0.01. ***p < 0.001. ****p < 0.0001.

Acknowledgments
This image is the copyrighted work of the attributed author or publisher, and ZFIN has permission only to display this image to its users. Additional permissions should be obtained from the applicable author or publisher of the image. Full text @ J Tissue Eng