
FIGURE 1
- ID
- ZDB-IMAGE-251004-62
- Genes
- Publication
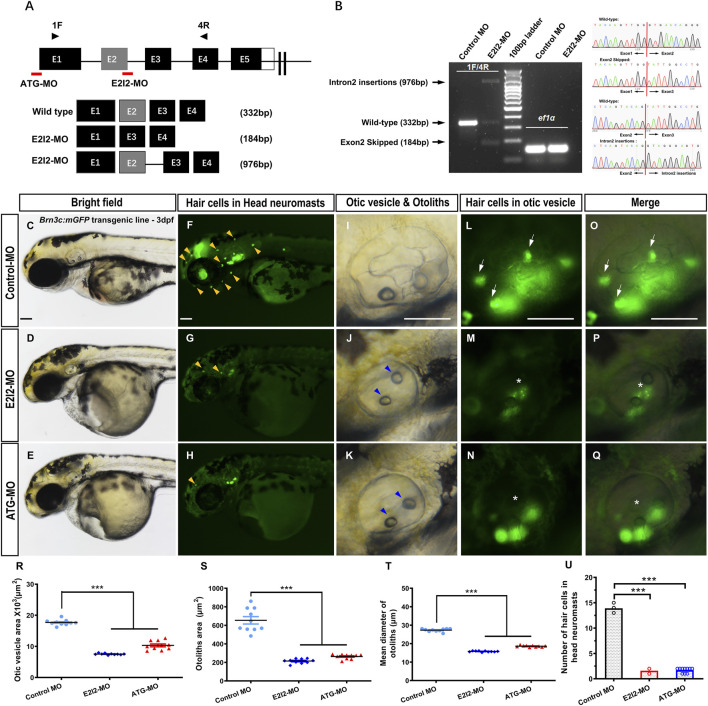
- Ma et al., 2025 - Functional characterization of MFSD3 in auditory system and zebrafish embryogenesis
- All Figures
- Figures for Ma et al., 2025
|
FIGURE 1
Phenotypes of auditory system in