
Image
|
Figure Caption
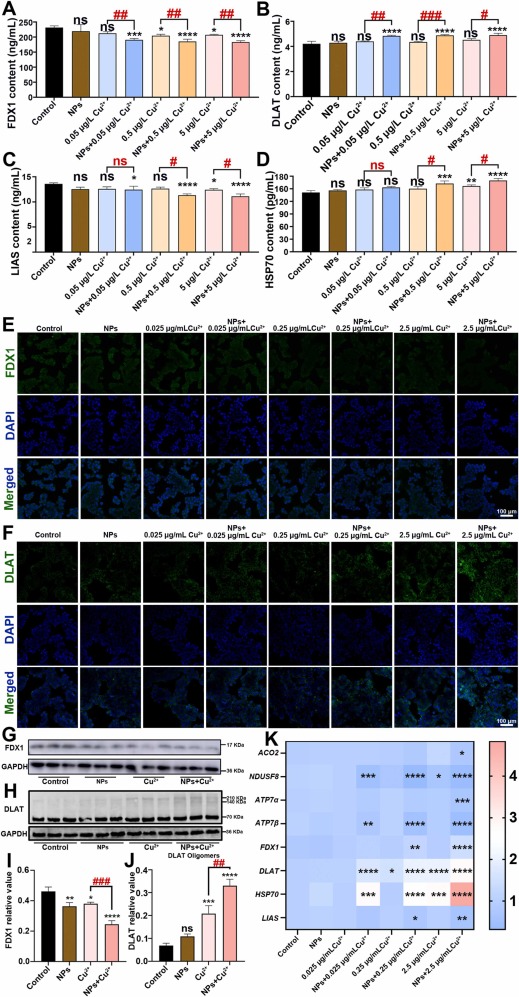
Fig. 6 PS-NPs and Cu2+ co-exposure changed key indicators of cuproptosis. ELISA was used to detect the related indicators of cuproptosis signaling pathway, including the FDX1 content (A), the DLAT content (B), the LIAS content (C), the HSP70 content (D), and the FDX1 and DLAT immunofluorescence images (E, F). The FDX1 and DLAT protein expression was detected by Western blot (G, H). The protein density was analyzed by Image J software (n = 3) (I, J), and the gene expression heat map related to cuproptosis was made as K (*/#P < 0.05, **/##P < 0.01, ***/###P < 0.001 and ****/####P < 0.0001).
Acknowledgments
This image is the copyrighted work of the attributed author or publisher, and
ZFIN has permission only to display this image to its users.
Additional permissions should be obtained from the applicable author or publisher of the image.
Full text @ Ecotoxicol. Environ. Saf.