
|
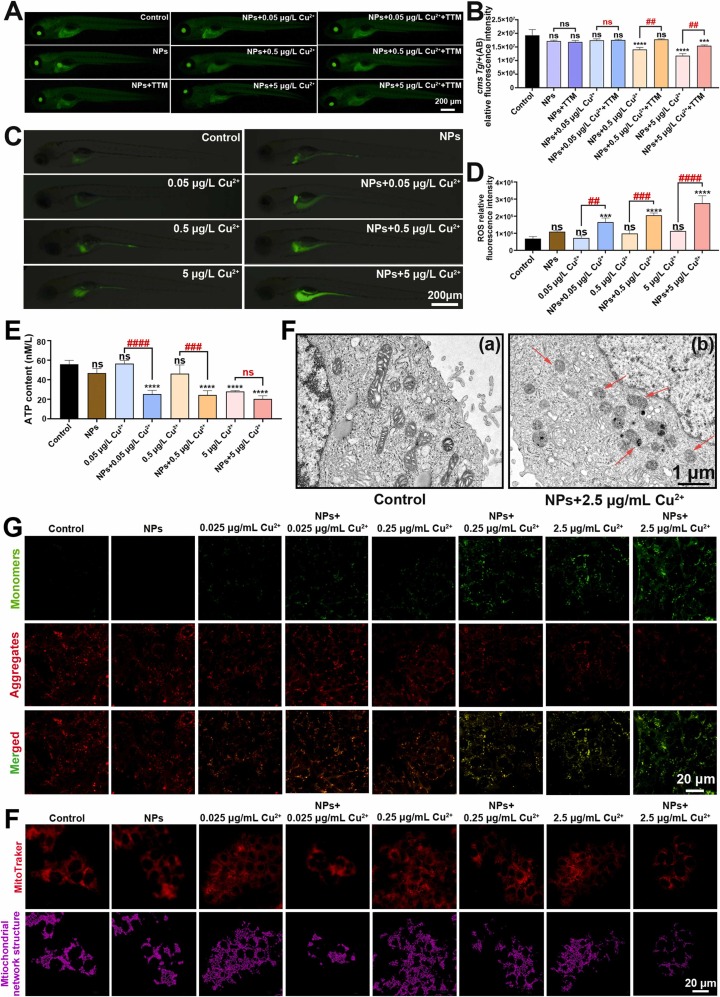
Fig. 4 PS-NPs and Cu2+ co-exposure changed the mitochondria number, ROS accumulation, mitochondrial ATP production, mitochondrial structure, membrane potential, and grid morphology. Fluorescence image of mitochondria quantification was displayed with cms Tg/+ (AB) zebrafish model (A) and was quantified (B). ROS content was detected in zebrafish larvae (C), and was quantified (D). ATP levels were measured in zebrafish larvae (E). The mitochondria morphological structure was detected by TEM, and abnormal mitochondria were indicated by red arrows (F). The changes of mitochondrial membrane potential were detected by laser confocal microscopy (G). The morphological changes of mitochondrial network in cells were detected by laser confocal microscopy (H) (*/#P < 0.05, **/## P < 0.01, ***/###P < 0.001 and ****/####P < 0.0001).