
|
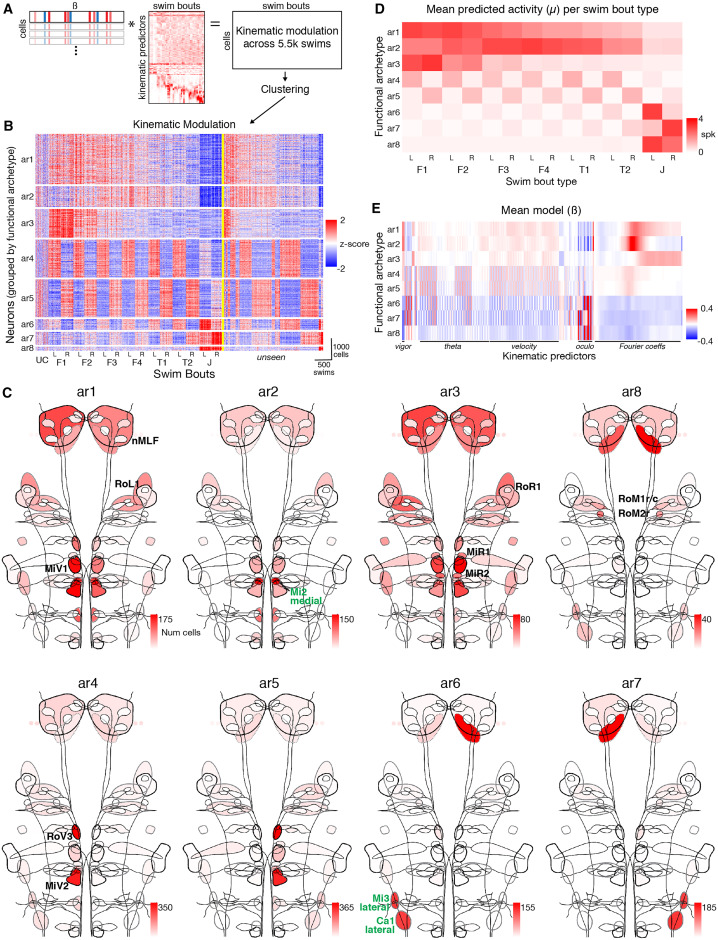
Fig. 5 RSN activity can be described by 8 functional archetypes (A) Schematic showing estimation of “kinematic modulation” (Xβ) across a common set of ∼5,000 swim bouts, using neurons’ best GLM models, followed by clustering. Note that X and Xβ are represented as their transposes to agree with our style convention of plotting β as a row vector. (B) Kinematic modulation vectors of all clustered neurons, organized by functional archetype (ar1–8). Similar patterns of modulation across swim bouts are observed within each archetype. Bouts to the right of the yellow line did not form part of the clustering process. Number of cells, n = 2,349 (ar1), 1,047 (ar2), 1,405 (ar3), 1,826 (ar4), 1,821 (ar5), 585 (ar6), 677 (ar7), and 231 (ar8). UC, unclassified swim bouts. (C) Maps showing number of cells of each anatomical label assigned to each functional archetype. (D) Model-predicted activity, μ, of each archetype across bout types. Values are means across cells belonging to each archetype. (E) Mean ENET model (β, fitted in the basis of singular vectors with relaxed coefficients) across cells assigned to each archetype.