
|
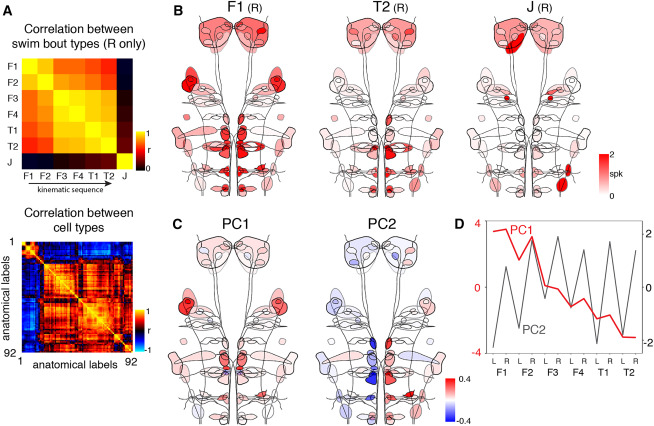
Fig. 3 Reticulospinal population activity varies systematically across locomotor space (A) Top: Pearson’s correlation between bout type activity vectors (right-lateralized swims only). The input matrix was of the form cell types × bout types, such that each column vector quantified the mean spike count across cells belonging to each anatomical type. Bottom: Pearson’s correlation between cell type activity vectors (input matrix was bout types × cell types). Activity for all swims (left and right) was used, and cell types have been ordered according to correlation distance between activity vectors. (B) RSN recruitment for 3 bout types, representing the extremes of the kinematic sequence (right-lateralized F1, T2, and J-turns). Maps show mean spike counts across all recorded cells. (C and D) Principal-component analysis was used to identify the main axes of variation in neural activity across bout types (excluding J-turns). (C) Loadings for first two PCs. (D) The first two PCs vary across bout types.