
Image
|
Figure Caption
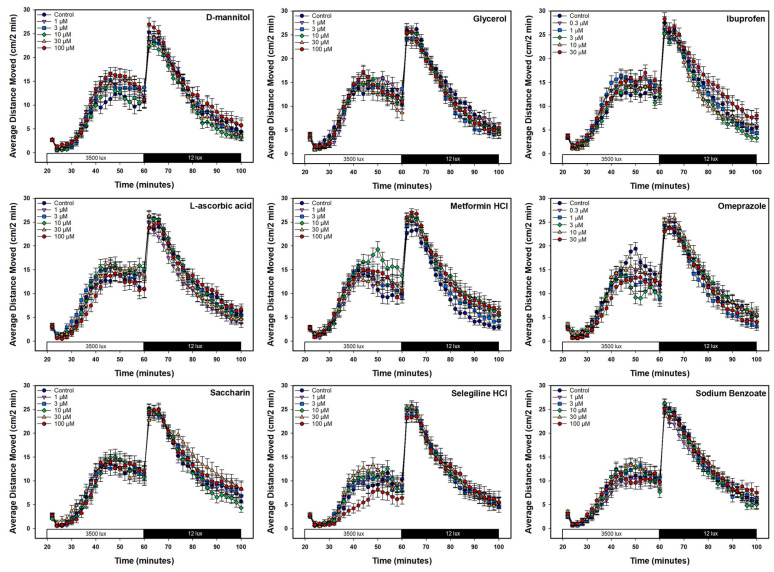
Figure 5
Line graphs for the nine candidate negative control chemicals show the average distance moved every 2 min (vertical axis) during the light–dark assay. Time (min) is shown on the horizontal axis with the first half of the session in the light (3500 lux) and the second half in the dark (12 lux). Vehicle control (DMSO) is represented by the navy-blue line and circle, while each chemical concentration is a different shape and line color.
Acknowledgments
This image is the copyrighted work of the attributed author or publisher, and
ZFIN has permission only to display this image to its users.
Additional permissions should be obtained from the applicable author or publisher of the image.
Full text @ Toxics