
Image
|
Figure Caption
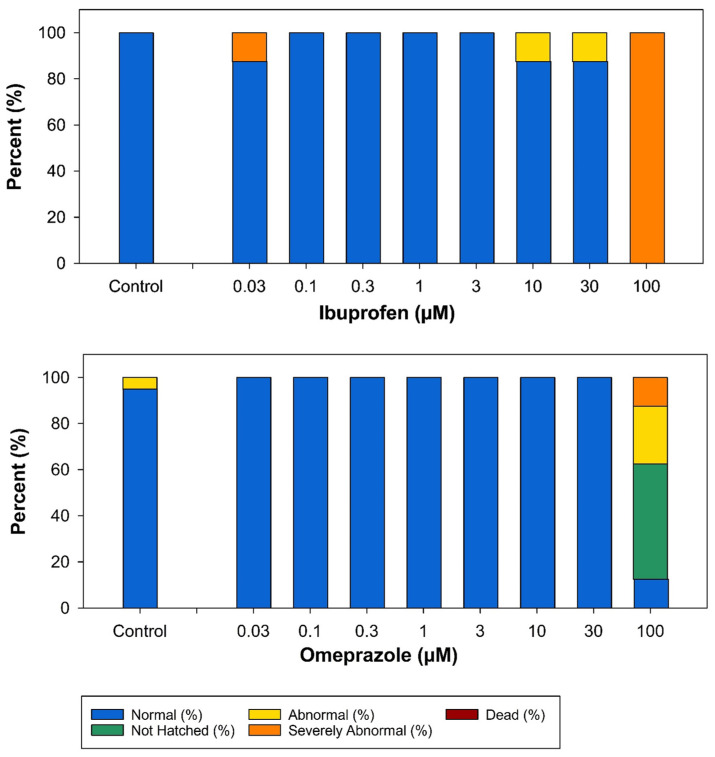
Figure 4
Bar graph showing the developmental toxicity results for ibuprofen and omeprazole at concentrations ≤ 100 µM (
Acknowledgments
This image is the copyrighted work of the attributed author or publisher, and
ZFIN has permission only to display this image to its users.
Additional permissions should be obtained from the applicable author or publisher of the image.
Full text @ Toxics