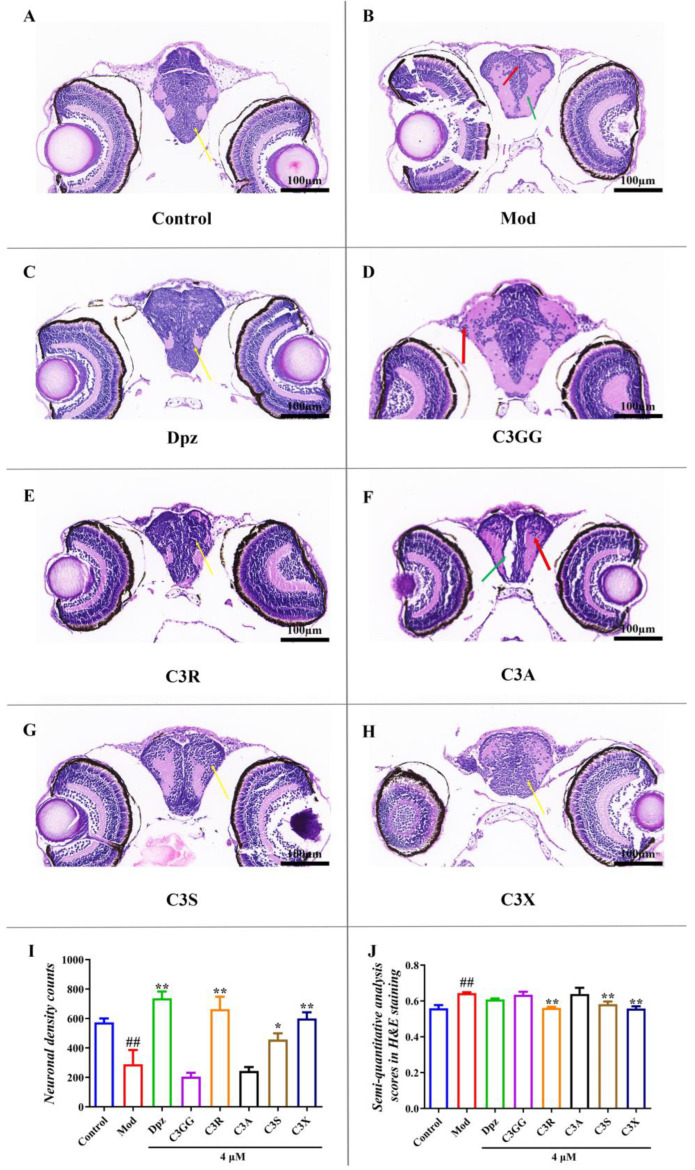
Comparison of histopathological alterations in brain tissues among various treatment groups. (A) Normal histological section of larval brain (40×). (B) Larvae brain exposed to 80 μM AlCl3 (40×). (C) Larvae brain exposed to AlCl3 + 4μM Dpz (40×). (D) Larvae brain exposed to AlCl3 + 4μM C3GG (40×). (E) Larvae brain exposed to AlCl3 + 4μM C3R (40×). (F) Larvae brain exposed to AlCl3 + 4μM C3A (40×). (G) Larvae brain exposed to AlCl3 + 4μM C3S (40×). (H) Larvae brain exposed to AlCl3 + 4μM C3X (40×). (I) Neuronal density in zebrafish brain. (J) semi-quantitative analysis scores in H&E staining. ## p < 0.01 vs. Con group, * p < 0.05 and ** p < 0.01 vs. model group. (The neurons are highlighted by yellow arrows. Red arrows indicate a small population of neurons exhibiting pyknosis and deeply stained necrosis, whereas green arrows point to areas of midbrain dilation accompanied by balloon-like degeneration).
This image is the copyrighted work of the attributed author or publisher, and
ZFIN has permission only to display this image to its users.
Additional permissions should be obtained from the applicable author or publisher of the image.
Full text @ Molecules
Your Input Welcome
Thank you for submitting comments. Your input has been emailed to ZFIN curators who may contact you if
additional information is required.
Oops. Something went wrong. Please try again later.