
Image
|
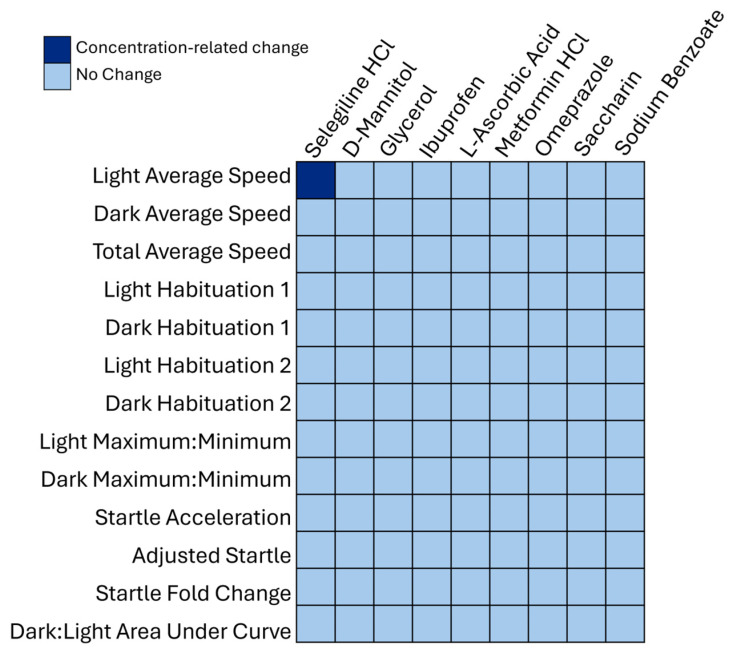
Figure Caption
Figure 7
Behavioral neurotoxicity results from a 13-endpoint analysis presented in a heatmap identifying only one endpoint (light average speed for selegiline hydrochloride) that revealed a concentration-related change based on the concentration–response modeling analysis, shaded dark blue. The endpoints that did not show any changes are shaded light blue. The 13 endpoints are listed on the vertical axis and chemicals on the horizontal axis.
Acknowledgments
This image is the copyrighted work of the attributed author or publisher, and
ZFIN has permission only to display this image to its users.
Additional permissions should be obtained from the applicable author or publisher of the image.
Full text @ Toxics