
Image
|
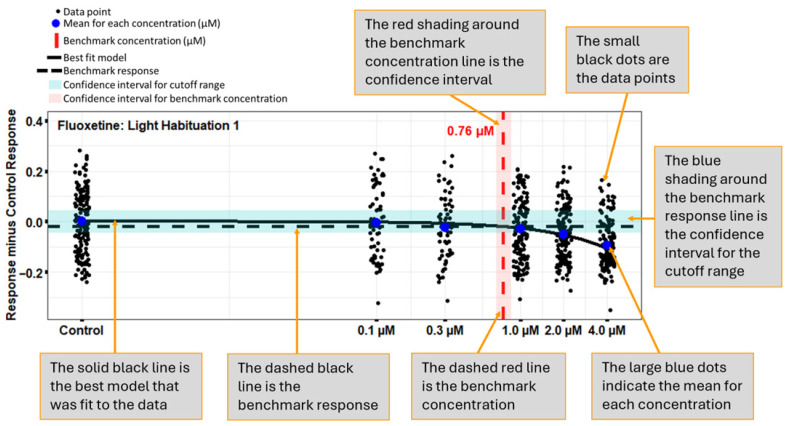
Figure Caption
Figure 3
Example of a benchmark concentration (BMC) graph for light habituation 1 following fluoxetine exposure, which depicts the response of each animal (small black dots), the average for each concentration (large blue dots), the benchmark response (dashed black line) with the cutoff range (blue shading), the best-fit model (solid black line), and BMC (µM) (dashed red line) with a confidence interval (red shading).
Acknowledgments
This image is the copyrighted work of the attributed author or publisher, and
ZFIN has permission only to display this image to its users.
Additional permissions should be obtained from the applicable author or publisher of the image.
Full text @ Toxics