IMAGE

Figure 2

ID
ZDB-IMAGE-250929-113
Source
Figures for Knapp et al., 2025
Image
Figure Caption

Figure 2

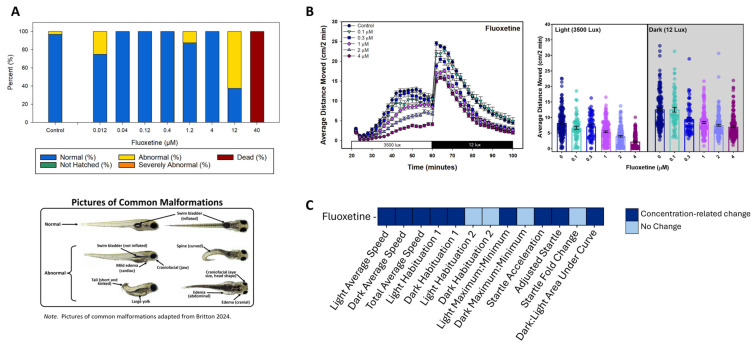
Fluoxetine results following the developmental toxicity and behavioral neurotoxicity experiments. The bar graph in Panel (A) presents data from the developmental toxicity observational assessments indicating the status (percent normal, not hatched, abnormal, severely abnormal, and dead); the vertical axis indicates percent (%) affected while the horizontal axis shows fluoxetine concentrations ≤ 40 µM (n = 28 for 40 µM and n = 8 for all lower concentrations). Beneath the graph are pictures of common malformations previously published by our laboratory [45]. The photos illustrate various malformations and normal-looking images. Panel (B) combines the four fluoxetine (0–4 µM) behavioral neurotoxicity experiments together and shows the average distance moved every two minutes in a line graph on the left, and a bar graph on the right with the average distance moved in the light and dark periods separately, with the average for each individual larva represented by the circles. Panel (C) presents the behavioral neurotoxicity results from a 13-endpoint analysis in a heatmap, identifying 9 of the 13 endpoints that displayed significant concentration-related changes.

Acknowledgments
This image is the copyrighted work of the attributed author or publisher, and ZFIN has permission only to display this image to its users. Additional permissions should be obtained from the applicable author or publisher of the image. Full text @ Toxics