
|
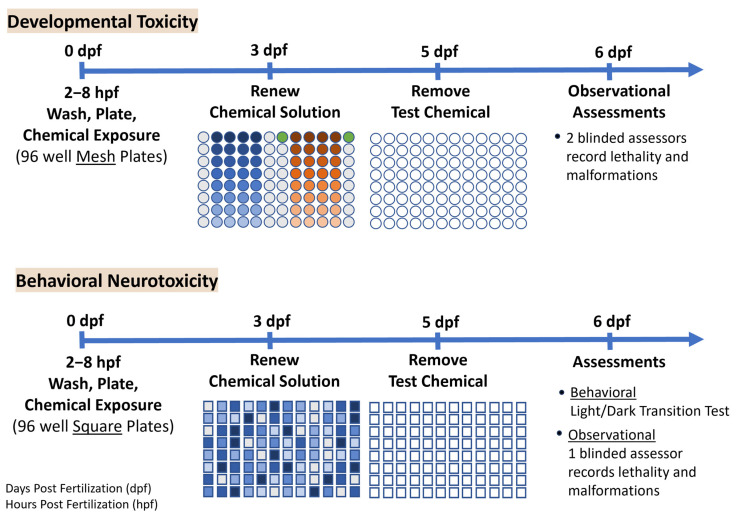
Figure 1
The experimental design presents a timeline for the developmental toxicity and behavioral neurotoxicity experiments from spawning through assessments. Procedures for the two studies were very similar, differing primarily in the type of plate (mesh or square-well), distribution of the chemicals on the plate (by column, or random), chemical renewal process due to plate type, and behavioral assessments included in the behavioral neurotoxicity experiment. Typical developmental toxicity plates included 2 test chemicals, represented by the blue and orange circles (color gradient represents the 8 concentrations for each chemical), light-grey circles represent DMSO vehicle control, and the green circles represent the positive control fluoxetine (40 µM). Only one test chemical was tested on each behavioral neurotoxicity plate, and concentrations were randomly distributed using the ECHO system. The color gradient represents the different chemical concentrations, and light-grey squares represent DMSO vehicle control. The different shades of blue represent an example of how the chemical concentrations might be distributed across the plate by the ECHO, with each shade of blue representing a concentration of the one chemical on that plate.