
Image
|
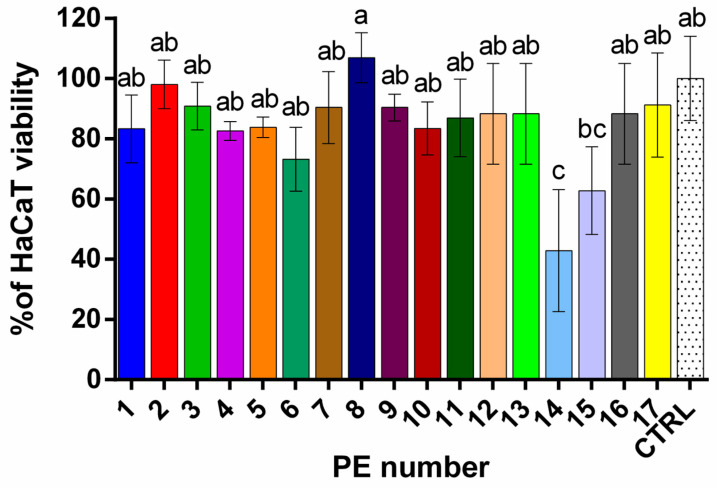
Figure Caption
Figure 3
Percentages (%) of HaCaT cell viability after treatment with the investigated PEs (5 µg/mL concentration), as determined by Tukey’s multiple comparison test. Different letters indicate statistically significant differences in cell viability among samples at
Acknowledgments
This image is the copyrighted work of the attributed author or publisher, and
ZFIN has permission only to display this image to its users.
Additional permissions should be obtained from the applicable author or publisher of the image.
Full text @ Plants (Basel)