
|
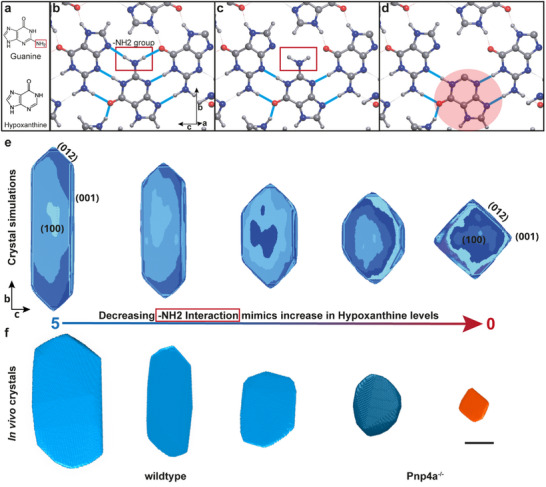
Figure 3
Zebrafish crystal macromorphology depends on H‐bond interaction strength between iridosomal purines. a) Chemical structure of guanine (top) and hypoxanthine (bottom). The two molecules only differ by a ‐NH2 group (red box). b) b‐c plane of the β‐guanine crystal structure. The amino group (red box) forms two hydrogen bonds (cyan) with neighboring guanine molecules. c) b‐c plane of β‐guanine crystal structure without the identified ‐NH2 hydrogen bond interactions (red box in b) corresponds to zero interaction strength in (e). d) b‐c plane of β‐guanine crystal structure with the central guanine molecule being exchanged by hypoxanthine (shaded red molecule). This hypothetical conformation does not have the two hydrogen bonds identified in the pure guanine lattice (red box in b). Like in (c), this corresponds to a scenario where hydrogen bond interactions would have zero cooperation. e) From left to right, simulated crystal morphologies from (c) in decreasing ‐NH2 interaction strength order (range 0–5). Note the striking similarity of simulated crystals with zero interaction strength with the obtained in vivo Pnp4a−/− crystals. f) From left to right, 3D rendered cryoFIB‐SEM crystals aligned with the closest resembling simulated crystal appearance. Scale bar: 1 µm. See also Figure