IMAGE

Figure 2

ID
ZDB-IMAGE-250927-22
Source
Figures for Rothkegel et al., 2025
Image
Figure Caption

Figure 2

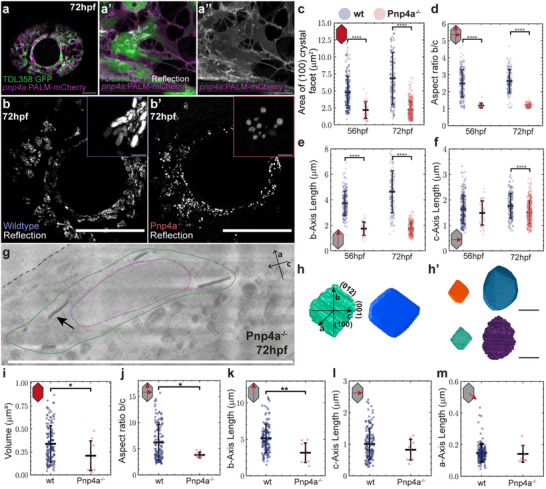
Pnp4a−/− crystals display distinct square‐like macromorphology due to an underdeveloped (001) crystal facet. a) Eye iridophores labeled in double transgenic TDL358:GFP (green) and pnp4a:PALM‐mCherry (magenta), with zoom highlighting co‐localization of expression and crystals’ reflection (white), at 72 hpf (a′‐a″). Scale bars: 50 µm (a), 10 µm (a’‐a″). b‐b’ Maximum intensity projection of confocal reflection images of larval eyes in wildtype (b) and Pnp4a−/‐ (b’) at 72 hpf. Insets highlight respective crystal morphologies. Scale bars: 100 µm, 5 µm (inset). c–f) Comparisons of 2D morphometric crystal measurements between wildtype (blue) and Pnp4a−/− mutants (red) at 56 and 72 hpf. Area of (100) crystal facet (c), Aspect ratio between lengths of b‐ and c‐axis (d), b‐axis length (e), and c‐axis length (f). N, number of crystals. 56 hpf, WT N = 227, Pnp4a−/−N = 41; 72 2.7kb‐hpf, WT N = 107, Pnp4a−/−N = 315. g) CryoFIB‐SEM slice of Pnp4a−/− iridophore at 72 hpf. Black arrow, guanine crystal. The FIB‐milling and imaging direction are parallel to the crystals’ a‐axis. Dash, eye surface. Green line, manual annotation of the cell membrane. Magenta line, manual annotation of the cell nucleus. Scale bar, 10 µm. h) 3D segmentation mask (left) and respective volumetric rendering (right) of a single Pnp4a−/− crystal, with crystallographic axes and respective facets annotated. h’ While crystals in Pnp4a−/‐ mutants express square‐like habits, the extent of their underdeveloped (001) facets presents a range of variability. Scale bars: 1 µm. i–m) Comparison of 3D morphometric measurements between wildtype (blue) (N = 139) and Pnp4a−/− crystals (red) (N = 10). Volume (i), Aspect ratio of b‐axis/c‐axis lengths (j), b‐axis length (k), c‐axis length (l), and a‐axis length (m). Asterisks indicate p‐values of unpaired, two‐tailed, non‐parametric t‐tests between groups: p < 0.05, ∗∗p < 0.01, ∗∗∗∗p < 0.0001. Error bars, standard deviation of the mean.

Acknowledgments
This image is the copyrighted work of the attributed author or publisher, and ZFIN has permission only to display this image to its users. Additional permissions should be obtained from the applicable author or publisher of the image. Full text @ Small Methods