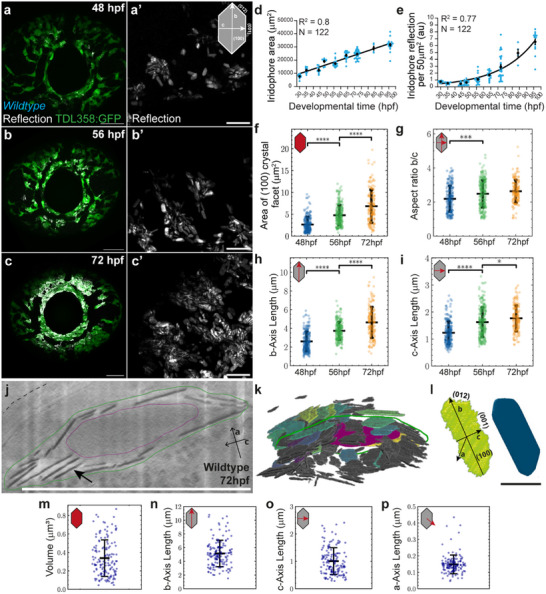
IMAGE

Figure 1

ID
ZDB-IMAGE-250927-21
Source
Figures for Rothkegel et al., 2025
Image
Figure Caption

Figure 1

Crystal reflection onset and morphology in larval zebrafish. a–c) Confocal microscopy maximum intensity projection images of larvae eyes of iridophore reporter line (TDL358:GFP, green) and reflection (white), at 48 hpf (a), 56 hpf (b) and 72 hpf (c), with zoom in on crystals (a’‐c’). Cartoon indicates crystallographic axes in 2D with respective crystal facets. Scale bars: a‐c 50 µm, a’‐c’ 10 µm. d,e) Iridophores’ area in the eye (d) increases linearly between 30 and 96 hpf (d; Line, linear fit with goodness of fit, R2), while iridophore reflection (e) increases exponentially within the same time interval, in the same cells (e, Line, exponential fit with goodness of fit, R2). Mean ±SEM, black lines. f–i) Morphometric measurements from 2D segmented crystals obtained from reflection imaging of wild‐type zebrafish eyes at three different time points. Area of (100) crystal facet (f), Aspect Ratio of b‐axis/c‐axis lengths (g), b‐axis length (h), and c‐axis length (i). Asterisks indicate p‐values of unpaired, two‐tailed, non‐parametric t‐tests between groups at each time point: p < 0.05, ∗∗∗p < 0.001, ∗∗∗∗p < 0.0001. Error bars, standard deviation of the mean. N, number of crystals. 48 hpf, N = 197; 56 hpf, N = 227; 72 hpf, N = 107. j) CryoFIB‐SEM slice of wildtype iridophore at 72 hpf. Guanine crystals appear dark due to their high density (black arrow) in comparison to the rest of the cell. The FIB‐milling and imaging direction are parallel to the crystals’ a‐axis (inset). Dash, eye surface. Green line, manual annotation of the cell membrane. Magenta line, manual annotation of the cell nucleus. Scale bar, 10 µm. k) 3D crystal reconstruction from (j). Segmented crystals are colored relative to volume, with darker colors corresponding to lower volumes. Cell outline (green) and nucleus (magenta) correspond to the ones depicted in (j). See also Movie S1 (Supporting Information). l) 3D segmentation mask (left) and respective volumetric rendering (right) of a single wildtype crystal (from k), with crystallographic axes and respective facets annotated. Scale bar: 1 µm. m–p) Measurements from 3D segmented crystals obtained from cryoFIB‐SEM imaging; N = 139 crystals. Volume (m), b‐axis length (n), c‐axis length (o), and a‐axis length (p).

Acknowledgments
This image is the copyrighted work of the attributed author or publisher, and ZFIN has permission only to display this image to its users. Additional permissions should be obtained from the applicable author or publisher of the image. Full text @ Small Methods