
IMAGE
Fig. 8
- ID
- ZDB-IMAGE-250922-21
- Publication
- Bacila et al., 2025 - Steroid 21-hydroxylase deficiency dysregulates essential molecular pathways of metabolism and energy provision
- All Figures
- Figures for Bacila et al., 2025
Image
|
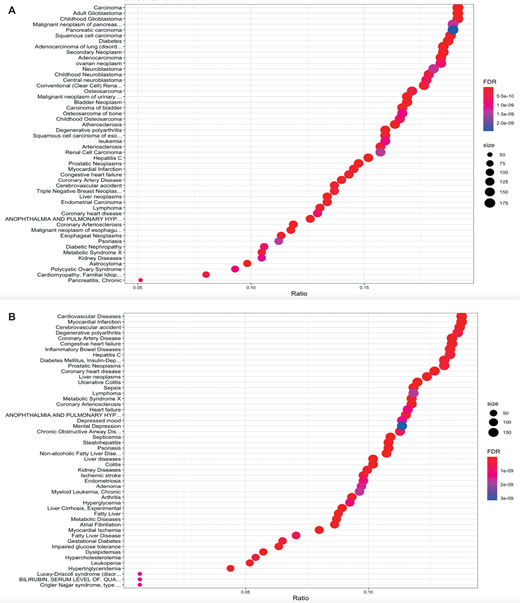
Figure Caption
Fig. 8 Associations between the cyp21a2−/−transcriptome and human disease in larvae (A) and male adult livers (B). Enrichment plot showing the associations between the transcriptomic changes in cyp21a2−/− mutants and human diseases, produced in R using the ‘disgenet2r’ package. The horizontal axis shows the ratio between the number of DEGs in a category and all DGEs, the size of the dots represents the number of DEGs in a category and the colour, the P-adj value.
Acknowledgments
This image is the copyrighted work of the attributed author or publisher, and
ZFIN has permission only to display this image to its users.
Additional permissions should be obtained from the applicable author or publisher of the image.
Full text @ Biol. Open