
IMAGE
Fig. 2
- ID
- ZDB-IMAGE-250922-15
- Publication
- Bacila et al., 2025 - Steroid 21-hydroxylase deficiency dysregulates essential molecular pathways of metabolism and energy provision
- All Figures
- Figures for Bacila et al., 2025
Image
|
Figure Caption
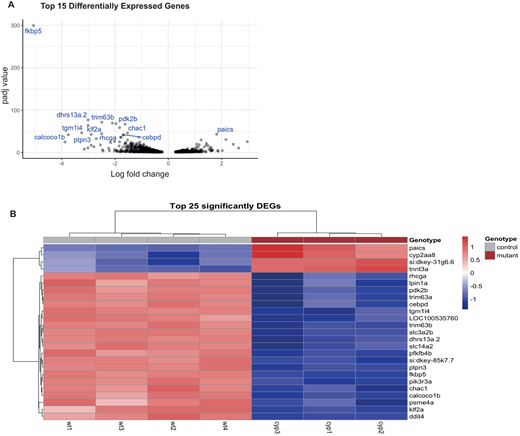
Fig. 2 Differential gene expression in cyp21a2−/−larvae. (A) Volcano plot showing the top 25 DEGs in cyp21a2−/− larvae, with statistical significance (P-adj) represented on the vertical axis and the LFC on the horizontal axis. (B) Heatmap and table indicating the top 25 DEGs in cyp21a2−/− larvae.
Acknowledgments
This image is the copyrighted work of the attributed author or publisher, and
ZFIN has permission only to display this image to its users.
Additional permissions should be obtained from the applicable author or publisher of the image.
Full text @ Biol. Open