
|
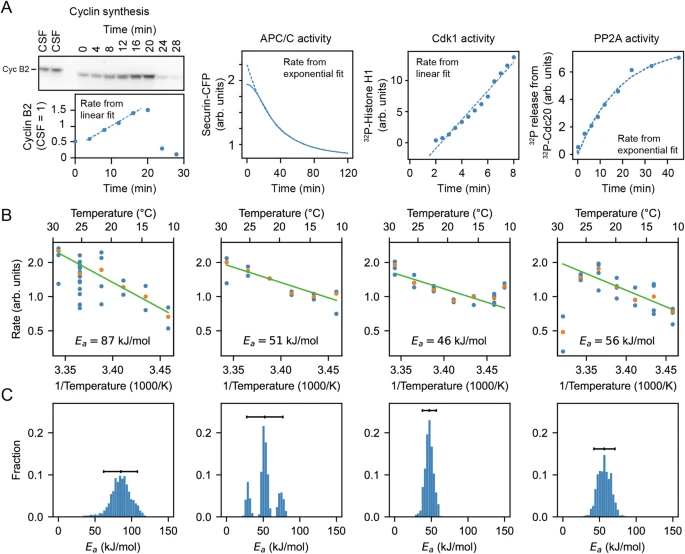
Fig. 6 Frog egg extract measurements reveal temperature dependence of cell cycle regulators. A Examples for how the rates for Cyclin B synthesis, APC/C activity, Cdk1 activity, and PP2A activity were fitted from time series of different biochemical assays using frog egg extracts at constant temperatures (here for T = 24 °C), see Supplementary Note 6. B The assays were repeated for temperatures in the interval 16−26 °C, and (apparent) activation energies were extracted. Blue dots represent data of individual fitted time series, while the orange dots are the medians per temperature. C Probability distribution of fitted (apparent) activation energies using bootstrapping with 90% confidence intervals (see Supplementary Note 2 for details on the bootstrap procedure). Source data are provided as a Source Data file96,98.