
|
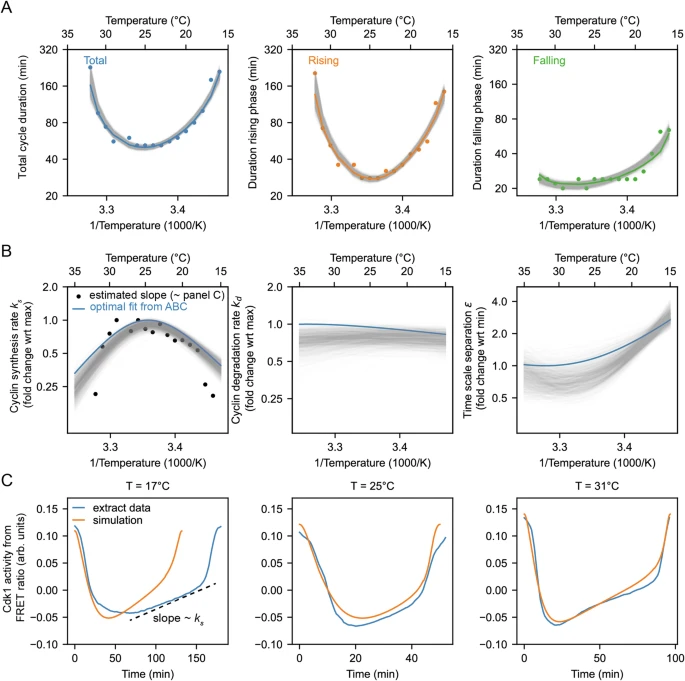
Fig. 5 Non-Arrhenius scaling as a result of biphasic cyclin synthesis rate and an imbalance in the temperature scaling of cyclin synthesis and degradation. A Using the ABC algorithm, we minimize the mean square error (MSE) between the measured and simulated (using the two-ODE model) durations of rising phase and falling phase. The measurements are shown with the dots. Each gray line shows the result of one parameter set from the outcome of the ABC algorithm (darker gray means larger weight). The colored line shows the best fit (curve resulting from parameter set with the smallest MSE). B Optimal temperature scaling of parameters, i.e., the cyclin synthesis rate, the cyclin degradation rate, and the time scale separation, resulting from the ABC algorithm as shown in (A). The black dots correspond to the cyclin synthesis rate ks (nM/min) directly estimated from the FRET ratio time series (Fig. S12 and Supplementary Note 4). C Blue line: averaged time series of Cdk1 activity (measured FRET ratio) at three different temperatures (T = 17 °C, T = 25 °C, T = 31 °C). See Fig. S13 and Supplementary Note 5 for the method to compute the average waveform. Orange line: time series of the computational model, computed using the optimal parameter scaling shown in Panel B. Source data are provided as a Source Data file96,98.