
Image
|
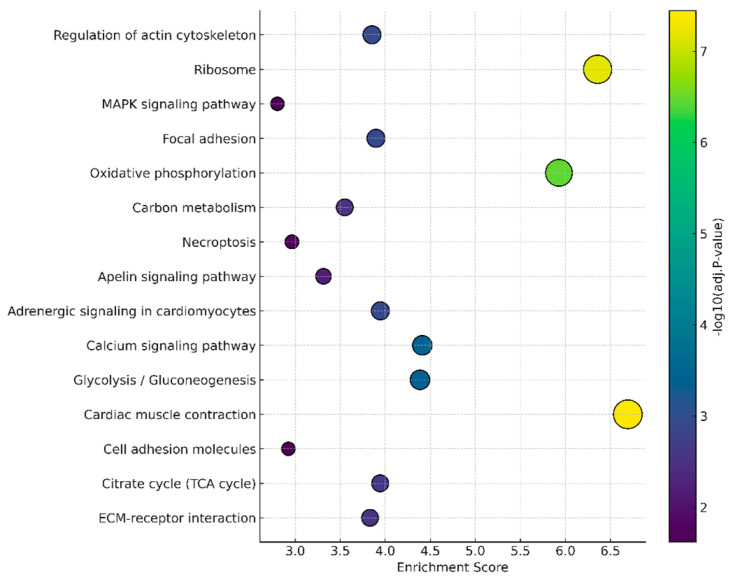
Figure Caption
Figure 5
Bubble plot representing the main enriched pathways according to the KEGG analysis. The Y-axis indicates the enriched pathways, while the X-axis represents the enrichment score.
Acknowledgments
This image is the copyrighted work of the attributed author or publisher, and
ZFIN has permission only to display this image to its users.
Additional permissions should be obtained from the applicable author or publisher of the image.
Full text @ Animals (Basel)