
Image
|
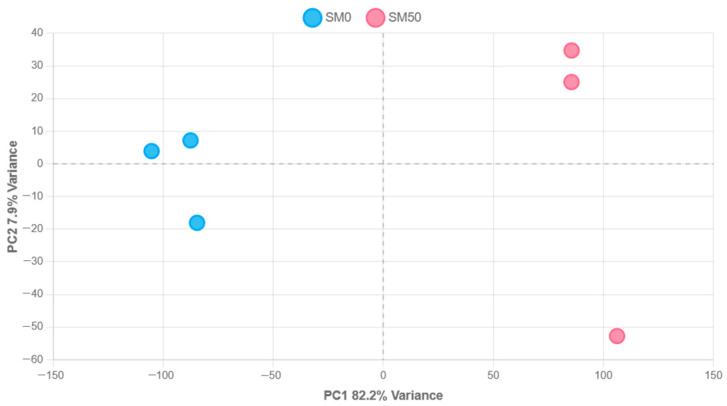
Figure Caption
Figure 2
Principal component analysis (PCA) of SM0 and SM50 samples. Each circle represents an individual biological replicate (SM0_R in light-blue,
Acknowledgments
This image is the copyrighted work of the attributed author or publisher, and
ZFIN has permission only to display this image to its users.
Additional permissions should be obtained from the applicable author or publisher of the image.
Full text @ Animals (Basel)