
|
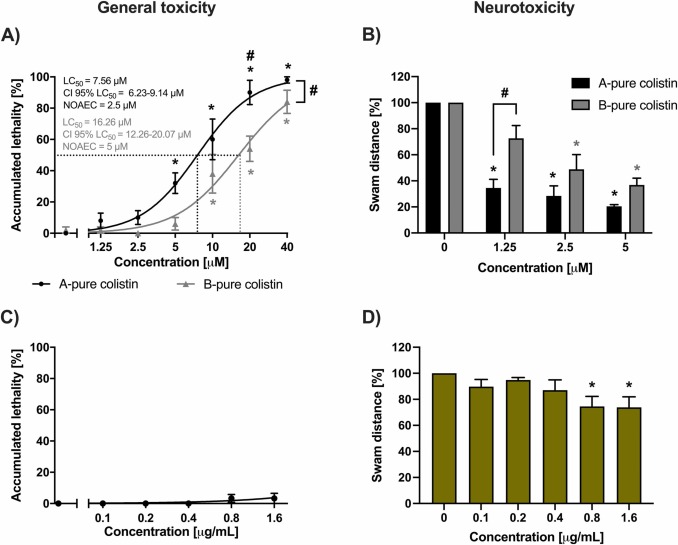
Fig. 7 Lethal and neurotoxic effects of colistin A and B. Comparison of A) lethality curves and B) TER assay obtained from zebrafish embryos exposed from 6 to 72 hpf to A-pure or B-pure colistin. C) Results of the accumulated lethality and D) TER assay from embryos exposed to the minority compounds of B-rich colistin formulation. Results are expressed as the mean ± SEM of a minimum of 3 independent experiments with 10 embryos per group in lethality assays (total of 30 embryos/group) or 6 for the touch-evoked response assay (total of 18 embryos/group). To compare the differences between colistin subtypes (A and B), two-way ANOVA with Sidak’s post-hoc test was used. One-way ANOVA with Bonferroni’s pos-hoc test was used to statistically identify differences between concentrations in lethality and TER assay (C and D). LC50 = Lethal concentration 50, CI 95 % LC50= 95 % confidence interval of the LC50, NOAEC= No Observed Adverse Effect Concentration. * Indicates differences with the control. # indicates differences between colistin types. In all cases a p < 0.05 was used to consider statistical differences.