
|
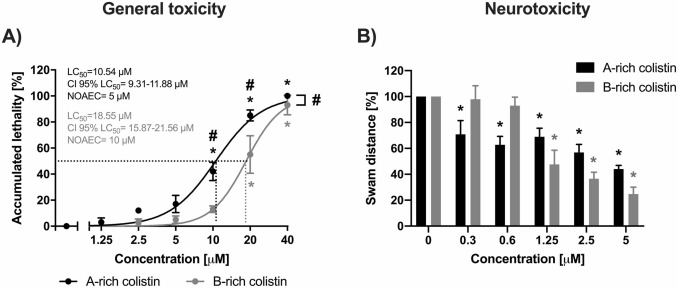
Fig. 2 Differences among two colistin mixtures in general and neurotoxicity. A) Comparison of the lethal curves obtained in zebrafish embryos at 72 hpf exposed to different concentrations of A-rich or B-rich colistin. B) Comparison of the results of the TER assay after exposure to A-rich or B-rich colistin expressed as the swam distance after the stimuli in % of the control. Results are presented as the mean ± SEM from at least three independent experiments, with 10 embryos/concentration for lethality experiments and 6 embryos/concentration for the TER. Statistical comparisons were performed using two-way ANOVA with Sidak’s post-hoc test for inter-branches comparisons. LC50 = Lethal concentration 50, CI 95 % LC50= 95 % confidence interval of the LC50, NOAEC= No Observed Adverse Effect Concentration. * Indicates a p value < 0.05 compared to control. # indicates a p value < 0.05 compared in inter-branches comparison.