
Fig. 3
- ID
- ZDB-IMAGE-250909-20
- Publication
- Wang et al., 2025 - Lacosamide Is a Novel Drug That Improves AGTPBP1 Knockout-Mediated Impairment of Neuronal and Dopaminergic Function
- All Figures
- Figures for Wang et al., 2025
|
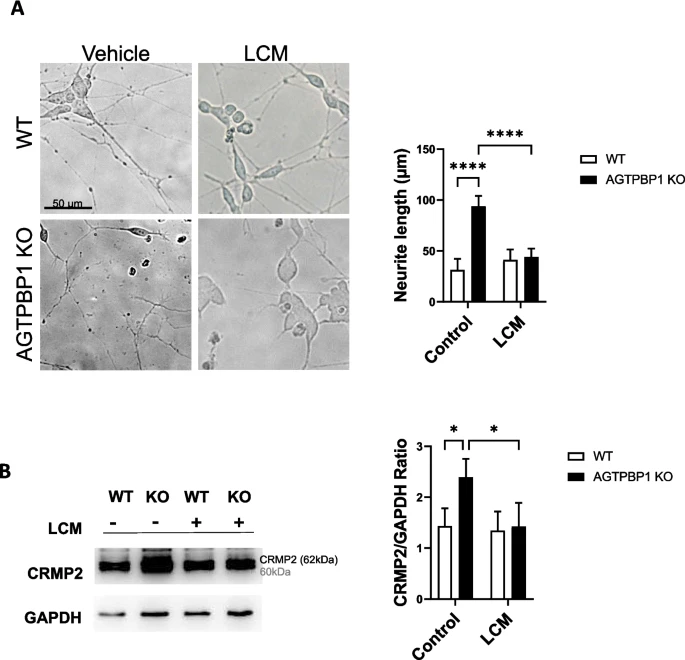
Fig. 3 LCM decreased neurite overgrowth and CRMP2 levels in AGTPBP1 KO cells. A Left: Phase contrast images of D7 WT and D7 AGTPBP1 KO cells under vehicle or LCM treatment. Scale bar = 50 µm. Right: Quantification of the longest neurite length. WT and AGTPBP1 KO cells, n = 17, from three independent experiments, p < 0.0001. For AGTPBP1 KO cells with and without LCM treatment, p < 0.0001. B Left: Western blot of CRMP2 of D7 WT and D7 AGTPBP1 KO cells under vehicle or LCM treatment. Right: Quantification of CRMP2 level. For WT and AGTPBP1 KO cells, n = 4, p = 0.0214. For AGTPBP1 KO cells with or without LCM treatment, p = 0.0205. *p < 0.05, ****p < 0.0001. Data were analyzed by two-way ANOVA, followed by Tukey’s test. Data were presented as mean ± SD