
Fig. 2
- ID
- ZDB-IMAGE-250909-19
- Publication
- Wang et al., 2025 - Lacosamide Is a Novel Drug That Improves AGTPBP1 Knockout-Mediated Impairment of Neuronal and Dopaminergic Function
- All Figures
- Figures for Wang et al., 2025
|
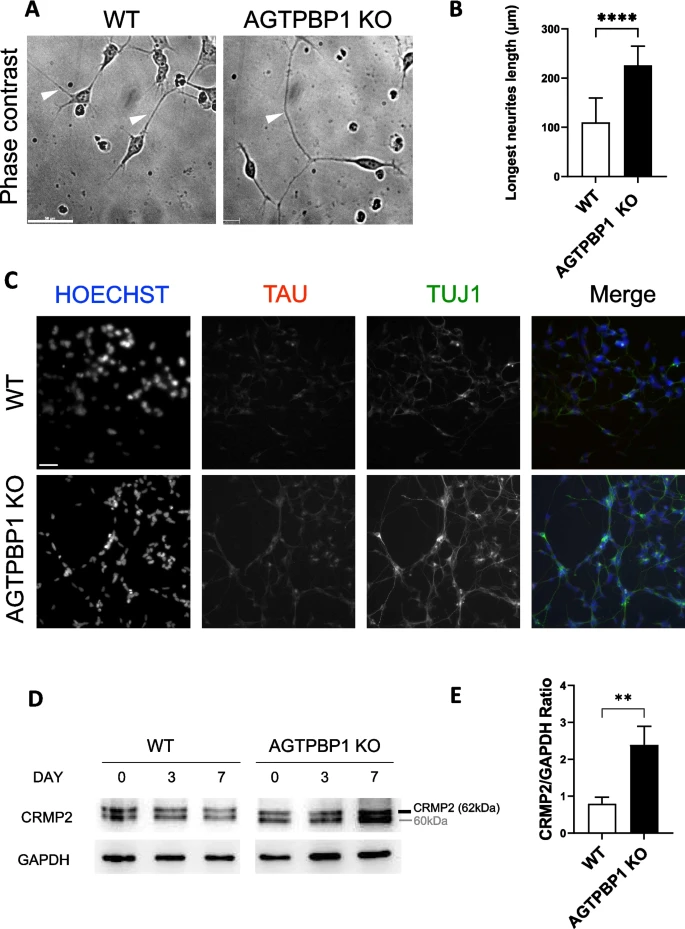
Fig. 2 Role of AGTPBP1 on neuronal differentiation. A Phase contrast image of differentiation day 7 of WT and AGTPBP1 KO cells. Scale bar = 50 µm; head arrow indicates the longest neurite. B Quantification of the longest neurite length in WT and AGTPBP1 KO cells at differentiation D7 (n = 10 from three independent experiments, p < 0.0001). C Immunostaining of TUJ1 and TAU on WT and AGTPBP1 KO cell at differentiation D7. Scale bar = 50 μm. D Western blotting of CRMP2 in WT and AGTPBP1 KO cells at differentiation D0, D3, and D7. CRMP2 is the upper band (62kDa). This antibody stains CRMP1 and CRMP2. There was significant difference in D7, but there was no difference in D3. E Quantification of CRMP2 Western blotting of WT and AGTPBP1 KO cells at differentiation D7 (n = 3, from three independent experiments, p = 0.0066). Data were analyzed by unpaired t-test and were presented as mean ± SD