IMAGE

Fig. 1.

ID
ZDB-IMAGE-250909-111
Source
Figures for Peloggia et al., 2025
Image
Figure Caption

Fig. 1.

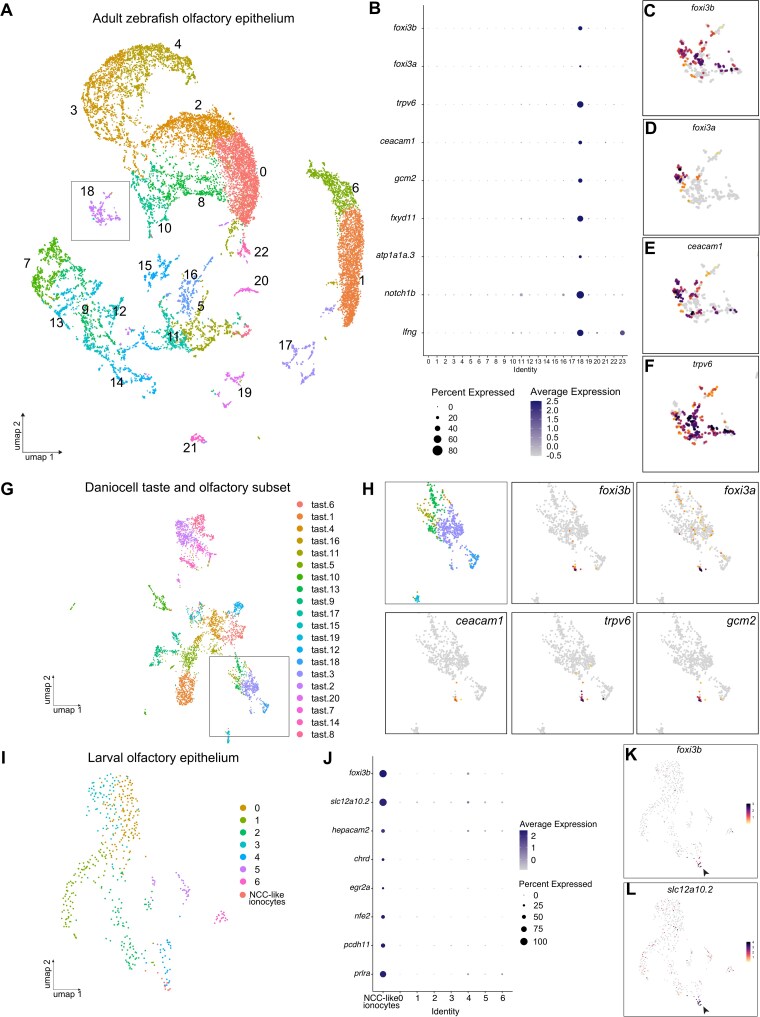
Single-cell RNA sequencing data analysis reveals expression of classical ionocyte-marker genes in the zebrafish olfactory organ. (A) UMAP plot showing 24 unannotated cell clusters (Identity) in the scRNA-seq dataset generated from dissected adult zebrafish olfactory organs. (B) Dot plot of data from A depicting several known ionocyte markers expressed in cluster 18. (C) Feature plots for foxi3b, (D)foxi3a, (E)ceacam1, and (F)trpv6. (G) UMAP plot of taste/olfactory subset from Daniocell, a scRNA-seq dataset generated from whole embryos and larvae (Sur et al. 2023). (H) Zoomed in feature plots for the ionocyte markers foxi3b, foxi3a, ceacam1, trpv6, and gcm2. (I) UMAP plot of olfactory subset from (Peloggia et al. 2021). (J) Dot plot of data from J showing several NCC ionocyte markers in foxi3b+ cells in the olfactory epithelium. (K) Feature plots for foxi3b and (L)slc12a10.2.

Acknowledgments
This image is the copyrighted work of the attributed author or publisher, and ZFIN has permission only to display this image to its users. Additional permissions should be obtained from the applicable author or publisher of the image. Full text @ Chem. Senses