IMAGE

Fig. 3

ID
ZDB-IMAGE-250906-49
Source
Figures for Shang et al., 2025
Image
Figure Caption

Fig. 3

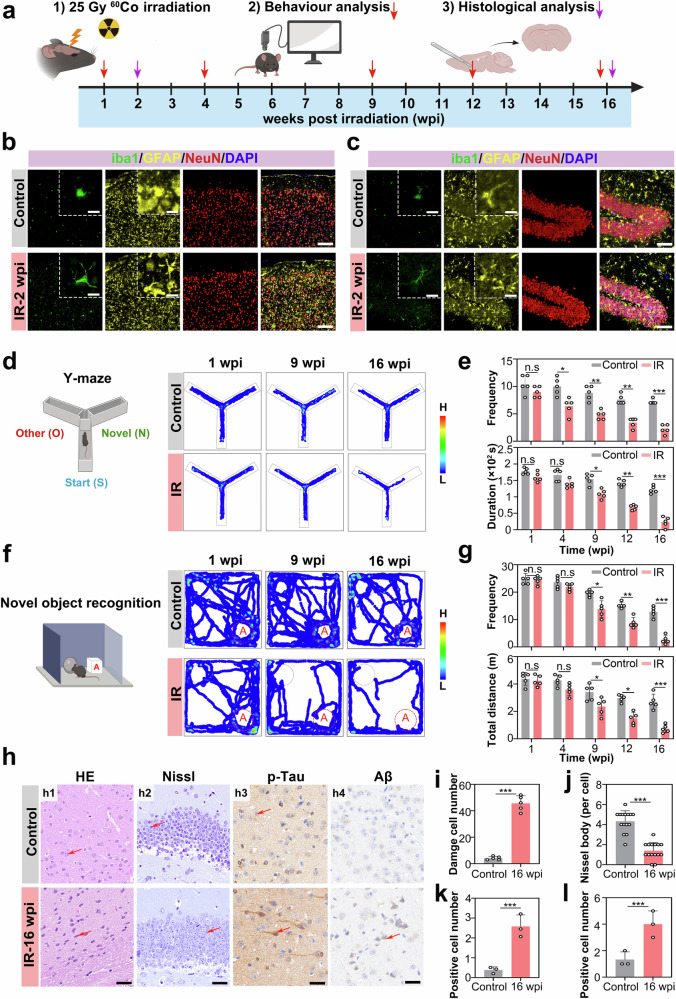
Focal χ-ray irradiation induces neuropathology in mouse brains. a Experimental timeline for focal-brain irradiation (25 Gy χ-rays) and subsequent analyses. Mice (6–8 weeks old) received a cumulative 25 Gy (5 Gy × 5 60Co χ-ray focal brain irradiation, followed by behavioral tests at 1, 4, 9, 12, and 16 wpi, with histological analyses at 16 wpi. b and c Immunofluorescence characterization of activated glial morphology in the cortex (b) and hippocampus (c) of mice at 2 wpi. Green fluorescence: microglial marker iba1; yellow fluorescence: astrocyte marker GFAP; red fluorescence: neuronal marker NeuN. d Y-maze behavioral profiling. Schematic of Y maze compartments: start arm (S), other arm (O), and novel arm (N). Heatmaps of exploration patterns at 1, 9, and 16 wpi. e Y-maze cognitive metrics. Number of arm entries and durations in the novel arm (n = 5 mice; one-way ANOVA). f Novel object recognition test. Schematic showing novel object A (cube). Heatmaps of exploration at 1, 9, and 16 wpi. g Recognition performance. Interaction frequency and distance traveled in relation to the novel object (n = 5 mice; one-way ANOVA). h Histopathological analysis at 16 wpi. HE staining (h1), Nissl staining of the hippocampal CA1 region (h2), phosphorylated Tau (p-Tau) immunohistochemical (DAB) staining (h3) and phosphorylated amyloid-beta (p-Aβ) immunohistochemical (DAB) staining (h4) were performed. i Quantification of degenerating neurons (n = 5 mouse sections; Student’s t test). j Quantification of Nissl bodies (n = 15 cells; Student’s t test). k Quantification of p-Tau-positive signals (n = 3 mouse sections; Student’s t test). l Quantification of DAB signals (n = 3 mouse sections; Student’s t test). All the statistical data are presented as the means ± SEMs. Scale bars: 20 μm, 5 μm (b, c), 100 μm (h1), 50 μm (h2), 20 μm (h3), and 20 μm (h4)

Acknowledgments
This image is the copyrighted work of the attributed author or publisher, and ZFIN has permission only to display this image to its users. Additional permissions should be obtained from the applicable author or publisher of the image. Full text @ Signal Transduct Target Ther