
|
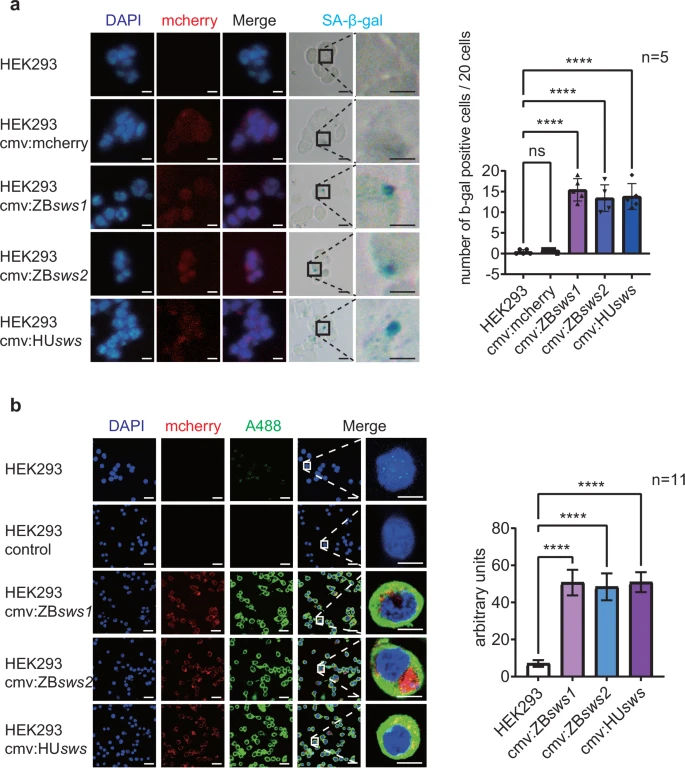
Fig. 4 Cell aging detection in sws-overexpressing HEK293 cells. a. SA-β-gal staining of cells overexpressing mcherry, zebrafish sws1, zebrafish sws2, or human sws (i.e., blue precipitate). SA-β-gal was not observed in the untransfected HEK293 cells and HEK293 control (cmv:mcherry) cells. Scale bar: 10 µm. Twenty cells were randomly selected from each section to count the number of SA-β-gal positive cells. One-way ANOVA: F(4, 20) = 50.42, p < 0.0001, R² = 0.9098; Dunnett’s multiple comparisons test: HEK293 vs. cmv:mcherry: mean diff. = −0.4000, 95% CI = [−4.354, 3.554], adjusted p = 0.9962, ns; HEK293 vs. cmv:ZBsws1: mean diff. = −15.00, 95% CI = [−18.95, −11.05], adjusted p < 0.0001, ****; HEK293 vs. cmv:ZBsws2: mean diff. = −13.00, 95% CI = [−16.95, −9.046], adjusted p < 0.0001, ****; HEK293 vs. cmv:HUsws: mean diff. = −13.40, 95% CI = [−17.35, −9.446], adjusted p < 0.0001, ****. Data are from 5 replicates per group and representative of three independent experiments. Source data are provided as a Source Data file. b. Immunofluorescence detection of P16 through confocal microscopy. The negative control group comprised HEK293 cells not exposed to primary antibodies. Scale bar: 10 µm. One-way ANOVA: F(3, 40) = 153.6, p < 0.0001, R² = 0.9201; Dunnett’s multiple comparisons test: HEK293 vs. cmv:ZBsws1: mean diff. = −43.63, 95% CI = [−49.62, −37.64], adjusted p < 0.0001, ****; HEK293 vs. cmv:ZBsws2: mean diff. = −41.31, 95% CI = [−47.30, −35.32], adjusted p < 0.0001, ****; HEK293 vs. cmv:HUsws: mean diff. = −43.84, 95% CI = [−49.82, −37.85], adjusted p < 0.0001, ****. Data are from 11 replicates per group and representative of three independent experiments.Source data are provided as a Source Data file.