
|
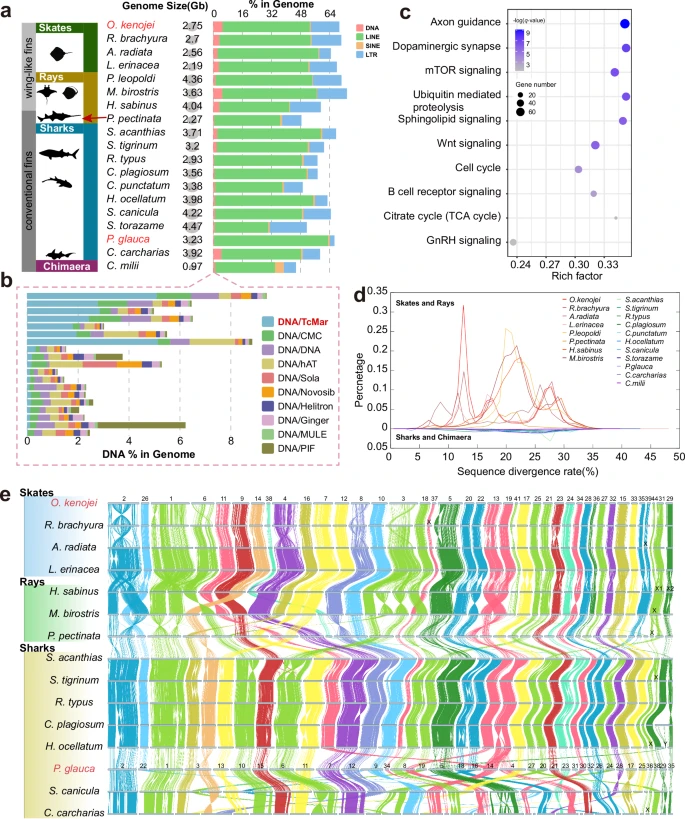
Fig. 1 Genomic characteristics of cartilaginous fishes. a Genome sizes and proportions of DNA transposons, LINEs, SINEs, and LTRs in cartilaginous fish genomes. b Top 10 abundant TE superfamilies of cartilaginous fishes. c Top 10 KEGG pathways of overlapped TcMar element blocks in cartilaginous fish genomes, including 3,530 genes shared by skates and rays but only 28 genes shared by sharks and chimaeras. d Divergence rates of Tc1/mariner TEs in cartilaginous fish genomes. e Pairwise whole-genome alignments across 15 chromosome-level assemblies of cartilaginous fishes. Each bar represents a chromosome, and the labels on top denote the chromosome IDs.