Figure Caption
Figure 3
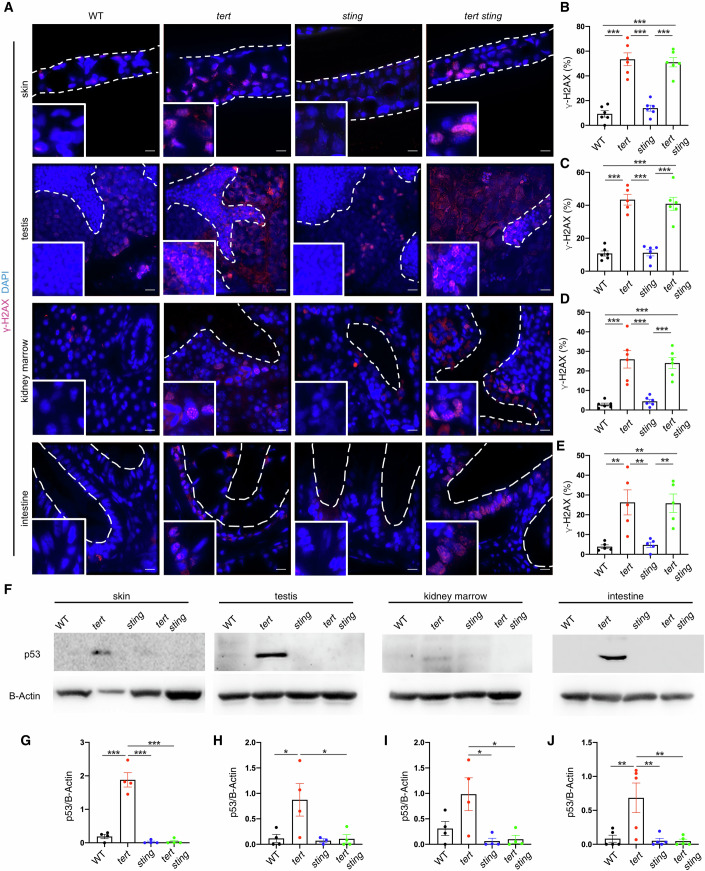
cGAS-STING pathway inactivation attenuates DNA damage response.
(A) Representative immunofluorescence images of DNA damage. Scale bar = 10 µm. (B) Quantification of DNA damage in skin (nWT = 6, ntert-/- = 6, nsting-/- = 6, ntert-/- sting-/- = 6; WT vs tert-/- p = 0.00001, sting-/- vs tert-/- p = 0.000001, WT vs tert-/- sting-/- p = 0.000001, sting-/- vs tert-/- sting-/- p = 0.000003). (C) Quantification of DNA damage in testis (nWT = 6, ntert-/- = 6, nsting-/- = 6, ntert-/- sting-/- = 6, N = 5–6, WT vs tert-/- p = 0.000001, sting-/- vs tert-/- p = 0.000001, WT vs tert-/- sting-/- p = 0.000001, sting-/- vs tert-/- sting-/- p = 0.000002). (D) Quantification of DNA damage in kidney marrow (nWT = 6, ntert-/- = 6, nsting-/- = 6, ntert-/- sting-/- = 6; WT vs tert-/- p = 0.00004, sting-/- vs tert-/- p = 0.0001, WT vs tert-/- sting-/- p = 0.0001, sting-/- vs tert-/- sting-/- p = 0.0003). (E) Quantification of DNA damage in intestine (nWT = 5, ntert-/- = 5, nsting-/- = 5, tert-/- sting-/- = 5; WT vs tert-/- p = 0.006, sting-/- vs tert-/- p = 0.008, WT vs tert-/- sting-/- p = 0.007, sting-/- vs tert-/- sting-/- p = 0.0095). (F) Representative western blot images of p53. (G) Quantification of p53 levels in the skin (nWT = 4, ntert-/- = 4, nsting-/- = 4, ntert-/- sting-/- = 4, WT vs tert-/- p = 0.000001, sting-/- vs tert-/- p = 0.000001, tert-/- vs tert-/- sting-/- p = 0.000001). (H) Quantification of p53 levels in the testis (nWT = 4, ntert-/- = 4, nsting-/- = 4, ntert-/- sting-/- = 4, WT vs tert-/- p = 0.050, tert-/- vs tert-/- sting-/- p = 0.048). (I) Quantification of p53 levels in the kidney marrow (nWT = 4, ntert-/- = 4, nsting-/- = 4, ntert-/- sting-/- = 4, sting-/- vs tert-/- p = 0.017, tert-/- vs tert-/- sting-/- p = 0.022). (J) Quantification of p53 levels in the intestine (nWT = 5, ntert-/- = 5, nsting-/- = 5, ntert-/- sting-/- = 5, WT vs tert-/- p = 0.009, sting-/- vs tert-/- p = 0.006, tert-/- vs tert-/- sting-/- p = 0.006). Data were presented as the mean ± s.e.m.; *p < 0.05; **p < 0.01, ***p < 0.001, using a one-way ANOVA and post hoc Tukey test. Source data are available online for this figure.
Acknowledgments
This image is the copyrighted work of the attributed author or publisher, and
ZFIN has permission only to display this image to its users.
Additional permissions should be obtained from the applicable author or publisher of the image.
Full text @ EMBO J.