
Fig. 1.
- ID
- ZDB-IMAGE-250904-13
- Publication
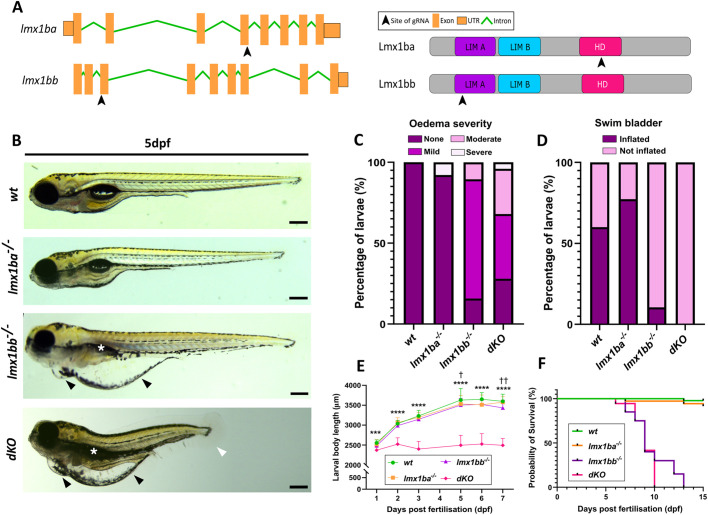
- Moss et al., 2025 - Characterisation of lmx1b paralogues in zebrafish reveals divergent roles in skeletal, kidney and muscle development
- All Figures
- Figures for Moss et al., 2025
|
Fig. 1.