
|
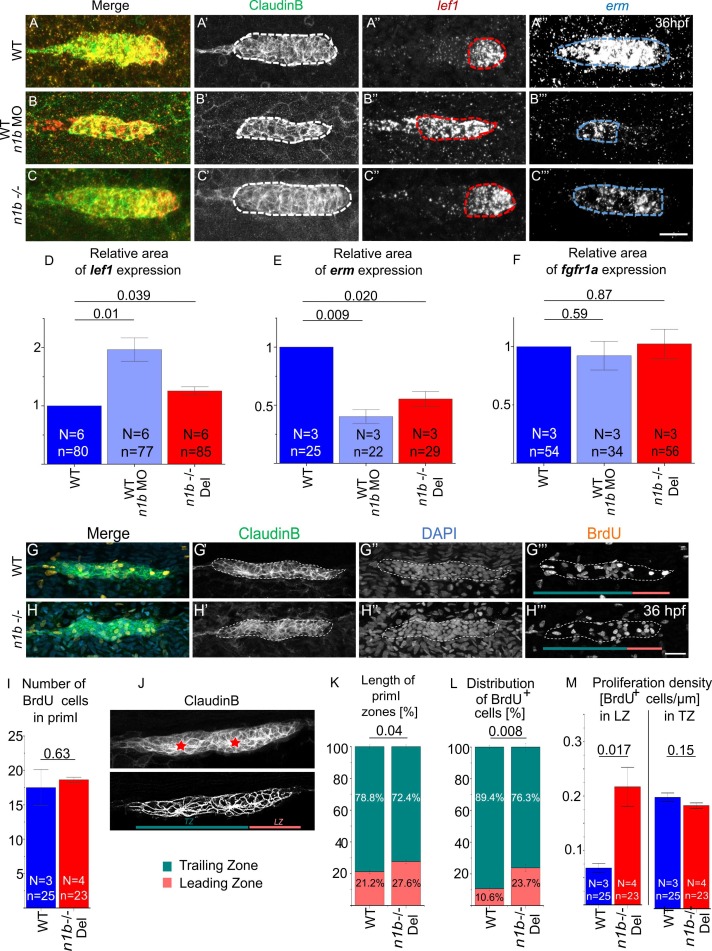
Fig. 2 Loss of ncam1b leads to small differences in signaling and proliferation within the migrating primordium. (A-C) Fluorescence in situ hybridization of 36 hpf Tg(ClaudinB::lynGFP) primordia in (A) WT, (B) ncam1b morphants, and (C) n1b -/- Del. Areas for expression analysis were delineated in Fiji by drawing around regions that displayed a strong signal compared to the background, while regions with only weak or faint signals were excluded. Red outline indicates lef1 expression area, blue outline indicates erm expression area. (D–F) Quantification of regions expressing (D) lef1, (E) fgfr1a (microscopy images shown in Supp. 3), and (F) erm. ncam1b absence leads to an enlarged lef1 region and a reduced erm region, fgfr1a expression domain is unaffected. (G–M) BrdU staining reveals changes in proliferating cell distribution. (G-H) WT and ncam1b mutant Tg(ClaudinB::lynGFP) embryos were treated with BrdU at 36 hpf for 20 min and immunostained for BrdU (orange), GFP (green) and DAPI (blue) as indicated. Color bars in (G''' + H''') indicate the respective zones in turquoise for the Trailing Zone and reddish for the Leading Zone. (I) Numbers of BrdU-positive cells in WT and n1b -/- Del primordia. (J) Illustration of the subdivision of primI into Leading (LZ) and Trailing Zones (TZ) based on cell morphology. The upper panel shows the original image, while in the lower panel the contrast was enhanced to better visualize morphological differences between the TZ and LZ. Cells in the TZ are organized into rosette-like proneuromasts (epithelial character). They are arranged radially around a central prospective first hair cell (asterisk). The cells in the LZ display a more randomly oriented, mesenchymal-like morphology. (K) Changes in the length of Leading and Trailing Zone in ncam1b mutants compared to the wild type. (L) Redistribution of proliferating cells within Leading and Trailing Zones. (M) Proliferation density, as calculated by dividing the number of BrdU+ cell by the zone length, is significantly higher in the Leading Zone of ncam1b mutants compared to wild type. Bars indicate mean values of the medians of each experiment, with error bars representing standard error. Statistical test for (D–F, I, M): Two-sided t-test and for (K+L): χ2-test. Scale bars 20 µm. Abbreviations: WT: Wild type; n1b -/- Del: ncam1b deletion mutant; MO: Morpholino; primI: primordium; TZ: Trailing Zone; LZ: Leading Zone.