
Image
|
Figure Caption
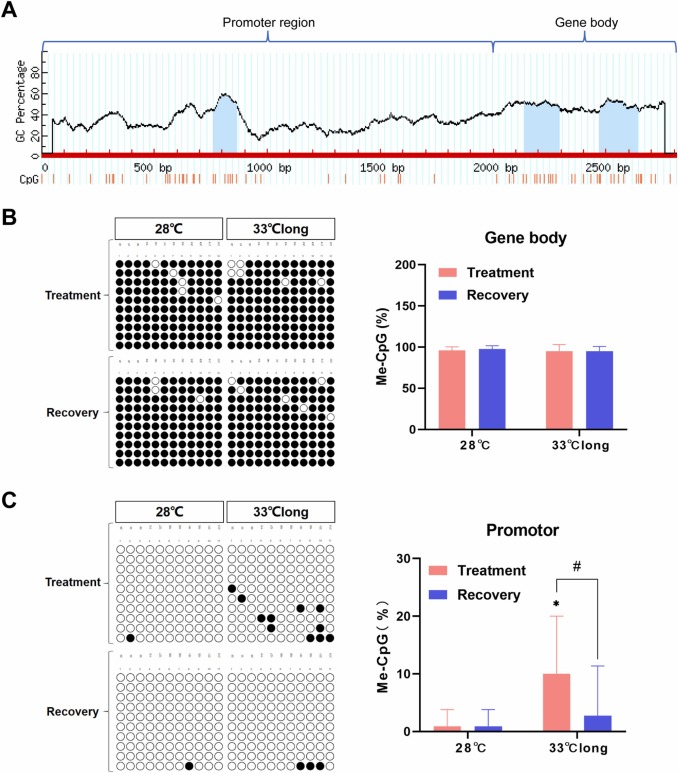
Fig. 5 Effect of long-term high temperature on DNA methylation levels of the tssk6 gene. (A) Analysis of CpG island in tssk6, the blue areas represent CpG islands. (B) Analysis of methylation sites in tssk6 gene body and the statistics of methylation level at 127 dph. (C) Analysis of methylation sites in tssk6 promoter region and the statistics of methylation level at 127 dph. Open and filled circles denoted unmethylated and methylated positions (n = 10). *P < 0.05, compared with 28℃ group. #P < 0.05, compared with recovery group. Data were presented as means ± SD.
Acknowledgments
This image is the copyrighted work of the attributed author or publisher, and
ZFIN has permission only to display this image to its users.
Additional permissions should be obtained from the applicable author or publisher of the image.
Full text @ Ecotoxicol. Environ. Saf.