
Fig. 6
- ID
- ZDB-IMAGE-250902-77
- Publication
- Abramova et al., 2025 - Disruption of grin2A, an epilepsy-associated gene, produces altered spontaneous swim behavior in zebrafish
- All Figures
- Figures for Abramova et al., 2025
|
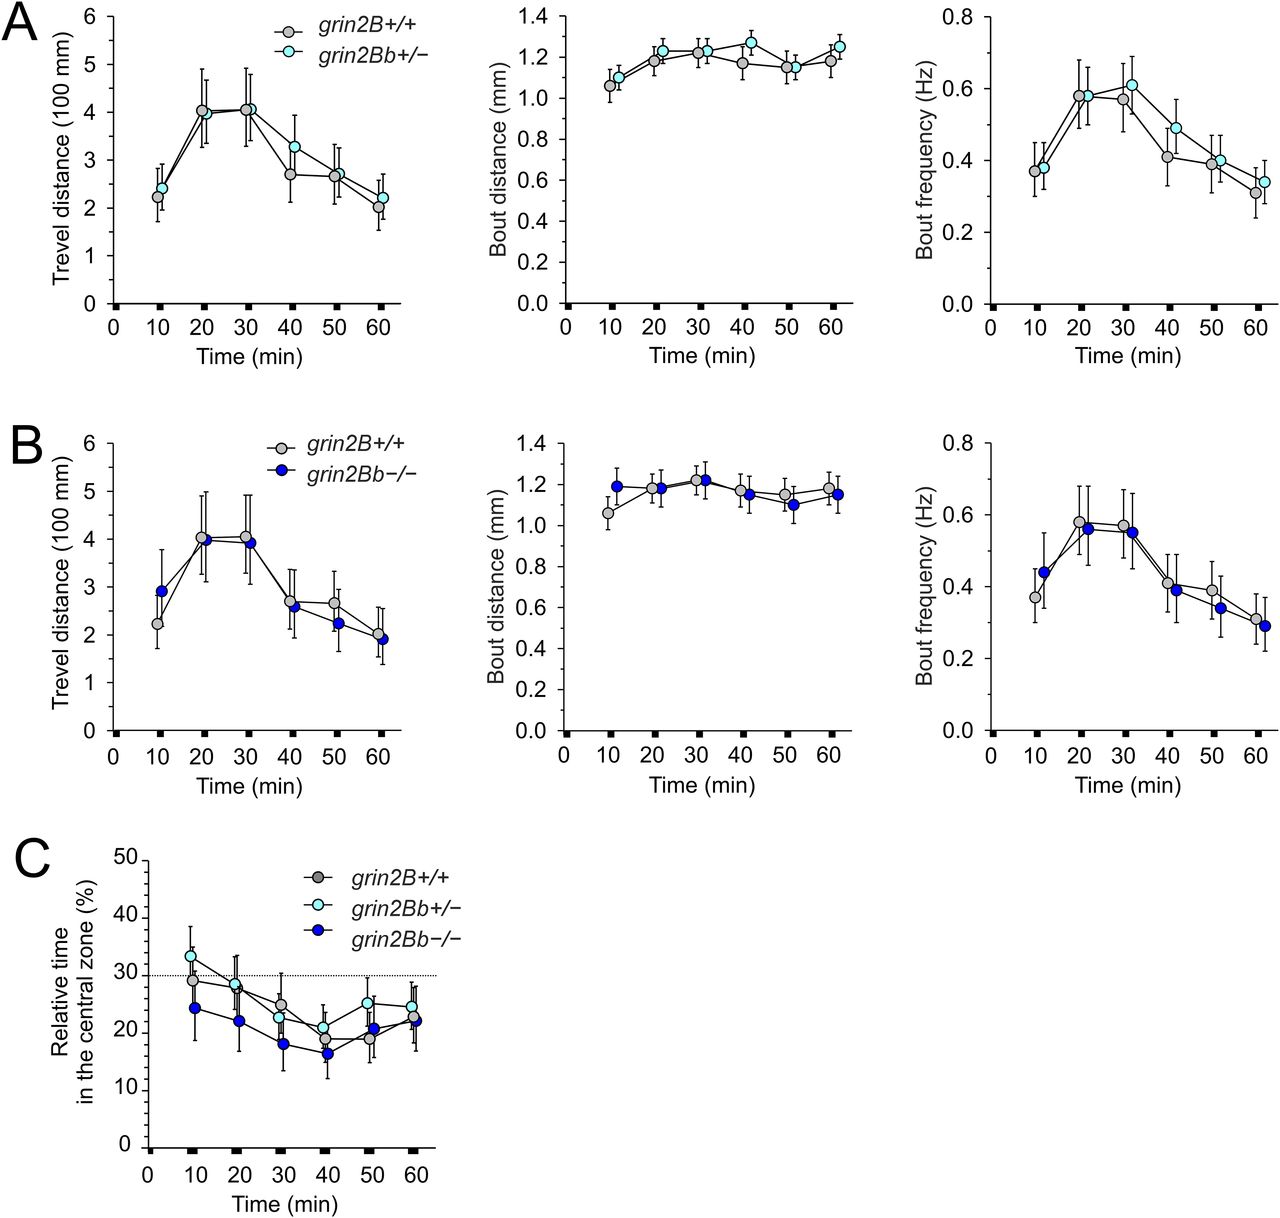
Fig. 6 No effect of grin2Bb deletion on larval locomotor activity and thigmotaxis. Comparison of the MTD, MBD, and MBF assessed in grin2Bb+/− (A) and grin2Bb−/− (B) larvae compared with grin2B+/+ larvae (6 dpf). C, Thigmotaxis measured as the relative time spent in the central zone by grin2Bb+/− and grin2Bb−/− larvae compared with grin2B+/+ larvae. The analysis of thigmotaxis was performed on the same larvae used to study locomotion. The dotted line indicates the level of randomness (30%). Data are expressed as mean ± 95% confidence interval of travel distance, bout distance, and bout frequency (A, B) and the relative time spent by larvae in the central zone (C); data were analyzed by ANOVA followed by the post hoc LSD tests (grin2B+/+, n = 198; grin2Bb+/−, n = 288; grin2Bb−/−, n = 144). grin2Bb+/− versus grin2B+/+, travel distance genotype, p = 0.18; time, p < 0.001; bout distance genotype, p = 0.37; time, p < 0.003; bout frequency genotype, p = 0.13; time, p < 0.002; the relative time larvae spent in the central zone genotype, p = 0.23; time, p < 0.002. grin2Bb−/− versus grin2B+/+, travel distance genotype, p = 0.97; time, p < 0.001; bout distance genotype, p = 0.53; time, p = 0.35; bout frequency genotype, p = 0.83; time, p < 0.001; the relative time larvae spent in the central zone genotype, p = 0.11; time, p = 0.23.